Cup and handle breakoutGood volume buildup in daily and weekly timeframe.
Cup and handle pattern breakout with good volume.
Fundamentals are OK.
FII and DII stakes are significantly increased as compared to last year.
NOTE: I do my analysis, do yours before trade.
MPHASIS trade ideas


Mphasis- Looking Really GoodGood Breakout. Mphasis heading towards new highs. Looking for 3700.
Just an Observation. Cheers.

Mphasis21/07/2024
Mphasis
CMP: 2873.55
Target: 3390-3660
SL: 2740
Information is only for study Purpose

Golden Crossover - MPHASIS📊 Script: MPHASIS
📊 Sector: IT - Software
📊 Industry: Computers - Software - Large
Key highlights: 💡⚡
📈 Golden Crossovers are seen into this Script.
📈 Golden Crossover is where slow moving average line crosses fast moving average above.
📈 Although Script is trading at All Time High we may see some bullish rally.
⏱️ C.M.P 📑💰- 2925
🟢 Target 🎯🏆 - 3098
⚠️ Important: Always maintain your Risk & Reward Ratio.
✅Like and follow to never miss a new idea!✅
Disclaimer: I am not SEBI Registered Advisor. My posts are purely for training and educational purposes.
Eat🍜 Sleep😴 TradingView📈 Repeat 🔁
Happy learning with trading. Cheers!🥂

MPHASIS S/R for 22/7/24Support and Resistance Levels: In technical analysis, support and resistance levels are significant price levels where buying or selling interest tends to be strong. They are identified based on previous price levels where the price has shown a tendency to reverse or find support.
Support levels are represented by the green line and green shade, indicating areas where buying interest may emerge to prevent further price decline.
Resistance levels are represented by the red line and red shade, indicating areas where selling pressure may arise to prevent further price increases. Traders often consider these levels as potential buying or selling opportunities.
Breakouts: Breakouts occur when the price convincingly moves above a resistance level (red shade) or below a support level (green shade). A bullish breakout above resistance suggests the potential for further price increases, while a bearish breakout below support suggests the potential for further price declines. Traders pay attention to these breakout signals as they may indicate the start of a new trend or significant price movement.
20 EMA: The yellow line denotes 20 EMA, to interpret the 20 EMA, you need to compare it with the prevailing stock price. If the stock price is below the 20 EMA, it signals a possible downtrend. But if the stock price is above the 20 EMA, it signals a possible uptrend.
Disclosure: I am not SEBI registered. The information provided here is for learning purposes only and should not be interpreted as financial advice. It is important to consult with a qualified financial advisor before making any investment decisions. Tweets neither advice nor endorsement.


MPHASIS cup and handle pattern MPHASIS cup and handle pattern continue green bars now take some time for breakout

MPHASIS BUYBUY MPHASIS WITH TARGET AND STRICT STOPLOSS ON WEEKLY BASED CUP AND HANDEL PATTERN. Mphasis a global Information Technology (IT) solutions provider specializing in providing cloud and cognitive services, applies next-generation technology to help enterprises transform businesses globally.

MPHASISSupport and Resistance Levels: In technical analysis, support and resistance levels are significant price levels where buying or selling interest tends to be strong. They are identified based on previous price levels where the price has shown a tendency to reverse or find support.

Mphasis Breakdown ChartMphasis Breakdown 30% up in next 3 months, current trend is showing an upside with good volume

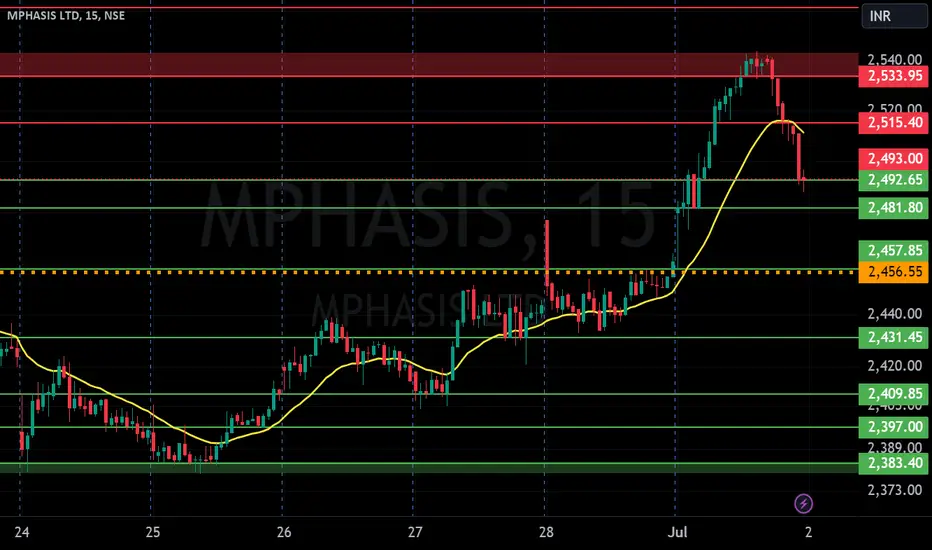
MPHASIS LTD S/R for 2/7/24Support and Resistance Levels: In technical analysis, support and resistance levels are significant price levels where buying or selling interest tends to be strong. They are identified based on previous price levels where the price has shown a tendency to reverse or find support.
Support levels are represented by the green line and green shade, indicating areas where buying interest may emerge to prevent further price decline.
Resistance levels are represented by the red line and red shade, indicating areas where selling pressure may arise to prevent further price increases. Traders often consider these levels as potential buying or selling opportunities.
Breakouts: Breakouts occur when the price convincingly moves above a resistance level (red shade) or below a support level (green shade). A bullish breakout above resistance suggests the potential for further price increases, while a bearish breakout below support suggests the potential for further price declines. Traders pay attention to these breakout signals as they may indicate the start of a new trend or significant price movement.
20 EMA: The yellow line denotes 20 EMA, to interpret the 20 EMA, you need to compare it with the prevailing stock price. If the stock price is below the 20 EMA, it signals a possible downtrend. But if the stock price is above the 20 EMA, it signals a possible uptrend.
Disclosure: I am not SEBI registered. The information provided here is for learning purposes only and should not be interpreted as financial advice. It is important to consult with a qualified financial advisor before making any investment decisions. Tweets neither advice nor endorsement.
MPHASIS STOCK BRACKOUT Buy :- 2405
Sl :- 2310
Trg :- 2560 , 2630
:- stock ek lambe time ke bad brackout Dene ja raha hai
:- full volume ke sath
:- buying side wo aachi opportunity mill sakti hai
:- CMP pe buying kar sakte hai par avr me
:- down' aane pe more qty add kar sakte hai

BUY in MPHASIS for TGT 2800Buy MPHASIS FOR OPEN TGT SL 2381 and TGT 2800.Mphasis Ltd. engages in the provision of application development and maintenance services, infrastructure outsourcing, and business and knowledge process outsourcing solutions.

MPHASIS- Yet another IT stock to Invest.MPHASIS-
Best buy is Sell side VWAP retest. However I think it should re test 2222 Magic Number.

buy at zone ~ intraday
- expecting small reversal from this zone
- good for intraday trade
ENTRY
- entry can be taken in two ways
1. place buy order at limit order , marked 0.58 level
2. look for confirmation in smaller time frame inside the zone.
STOP LOSS
- if candle close is below 0.618 level.
TARGET
- mark fib retracement from C to latest swing low
- TGT - 0.236

MPHASIS LongMphasis is at support, can be entered with short term bounce up to 2500.
Note:- This is my analysis and not a trade recommendation.

MPHASIS Potential LONG Entry in 1Hr TFMPHASIS - Looking like a good LONG entry from here.
Once the Risological Karma goes green, it is an entry point.
Good short term gains on this trade, will update you how it goes.

SWING IDEA - MPHASIS In this post, our spotlight is on Mphasis , a stock that has piqued our interest as a potential candidate for a swing trade, presenting the prospect of an upward rally.
Reasons are listed below :
The recent breakthrough of the 2450-2500 zone, coupled with a subsequent retest, suggests a solid foundation and potential support at these levels.
Holding steadfast at the 0.382 Fibonacci retracement level, this stock showcases resilience and a reinforcing support structure.
The presence of a bullish continuation candle on the weekly timeframe adds weight to the analysis, signaling positive momentum for potential upward movement.
A consistent pattern of forming higher highs underscores a sustained uptrend, reflecting positive market sentiment.
Trading above both the 50 and 200 EMAs affirms the stock's commitment to the prevailing uptrend, further bolstering the case for a potential swing trade.
Target - 3373 // 3653
StopLoss - weekly close below 2515
DISCLAIMER :
Decisions to buy, sell, hold or trade in securities, commodities and other investments involve risk and are best made based on the advice of qualified financial professionals. Any trading in securities or other investments involves a risk of substantial losses. The practice of "Day Trading" involves particularly high risks and can cause you to lose substantial sums of money. Before undertaking any trading program, you should consult a qualified financial professional. Please consider carefully whether such trading is suitable for you in light of your financial condition and ability to bear financial risks. Under no circumstances shall we be liable for any loss or damage you or anyone else incurs as a result of any trading or investment activity that you or anyone else engages in based on any information or material you receive through TradingView or our services.
@visionary.growth.insights

Multiple patterns formation {ABCD+CUP HANDLE+FLAG)Mphasis is forming ABCD pattern on long time frame
Cup and handle on weekly
and flag on daily time frame
EXPECTING 17 TO 65 % move in this counter
keep stoploss of 2650 on day close basis

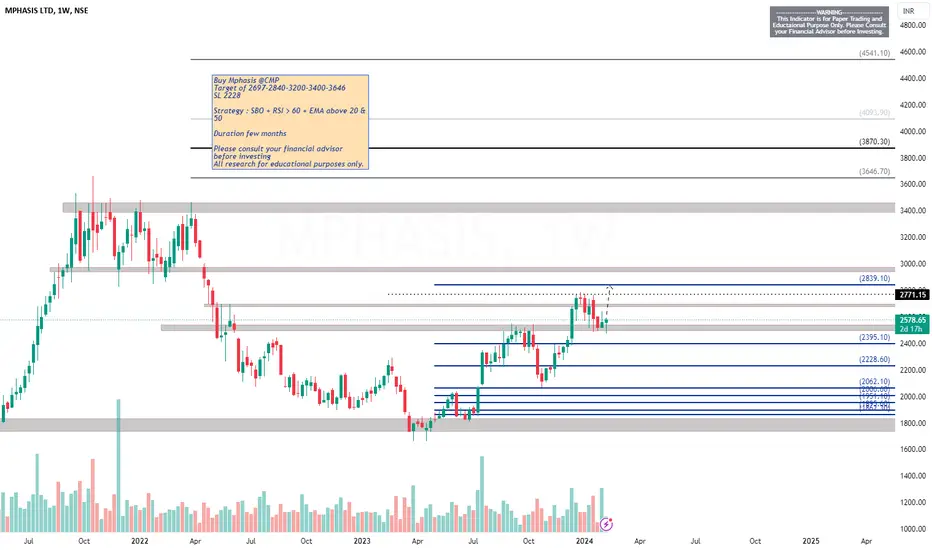
Mphasis Long PostionalBuy Mphasis @CMP
Target of 2697-2840-3200-3400-3646
SL 2228
Strategy : SBO + RSI > 60 + EMA above 20 & 50
Duration few months
Please consult your financial advisor before investing
All research for educational purposes only.
Multiple chart pattern in MPHASISMPHASIS
Triangle pattern breakout done already
Bullish candle near breakout
Volume supporting
forming rounding bottom pattern

MPHASIS LTDTechnicals:
--> Seems that during July 2023, the price of the asset took support on the trendline which was formed back in May 2021.
--> From that point on, the price moved to complete the cup and handle pattern and also broke out of the pattern.
--> After breaking out, the price had retested the new support levels formed basis C&H pattern.
Please suggest if any error or omission in the analysis and if possible please let know if any of you done proper fundamental analysis from your side just to improve my self.
