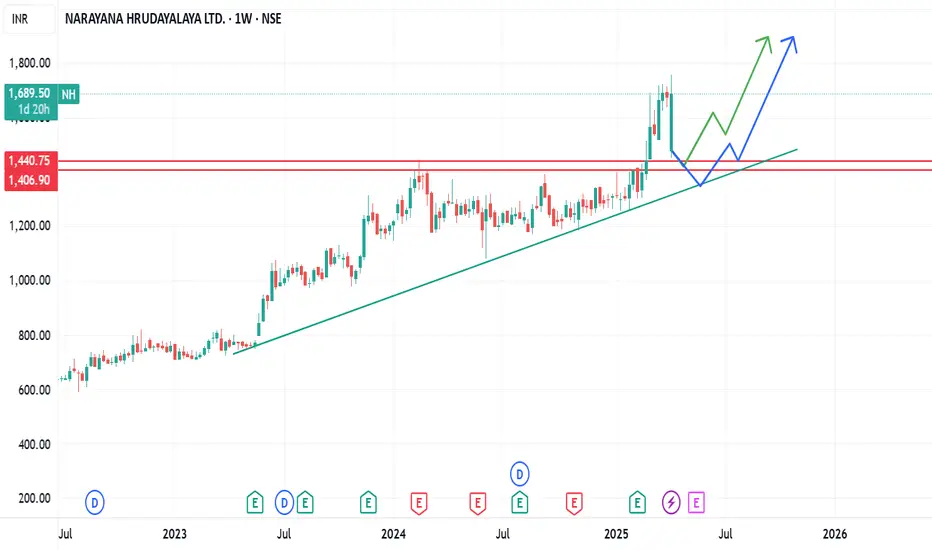
Narayana Hrudayalaya can turnaround from trendline. Narayana Hrudayalaya Ltd. engages in the provision of medical and health care services. It also provides services in the areas of cardiac surgery, cardiology, diabetes and endocrinology, gastroenterology, general surgery, neurosciences, facial surgery, nephrology, obstetrics and gynecology, orthopedics, oncology, pediatrics, transplant, urology, and vascular surgery; and other specialty services, such as dental, dermatology, emergency medicine, ears, nose, and throat, family medicine, general medicine, and genetic.
NH Closing price is 1945.50. The positive aspects of the company are Companies with Zero Promoter Pledge, Company able to generate Net Cash - Improving Net Cash Flow for last 2 years and FII / FPI or Institutions increasing their shareholding. The Negative aspects of the company are high Valuation (P.E. = 50.6), Stocks Underperforming their Industry Price Change in the Quarter, Increasing Trend in Non-Core Income, PEG greater than Industry PEG and MFs decreased their shareholding last quarter
Entry can be taken after closing above 1950 Historical Resistance in the stock will be 2015, 2063 and 2098. PEAK Historic Resistance in the stock will be 2148, 2195 and 2269. Stop loss in the stock should be maintained at Closing below 1863 or 1648 depending upon your risk taking ability.
Disclaimer: The above information is provided for educational purpose, analysis and paper trading only. Please don't treat this as a buy or sell recommendation for the stock or index. The Techno-Funda analysis is based on data that is more than 3 months old. Supports and Resistances are determined by historic past peaks and Valley in the chart. Many other indicators and patterns like EMA, RSI, MACD, Volumes, Fibonacci, parallel channel etc. use historic data which is 3 months or older cyclical points. There is no guarantee they will work in future as markets are highly volatile and swings in prices are also due to macro and micro factors based on actions taken by the company as well as region and global events. Equity investment is subject to risks. I or my clients or family members might have positions in the stocks that we mention in our educational posts. We will not be responsible for any Profit or loss that may occur due to any financial decision taken based on any data provided in this message. Do consult your investment advisor before taking any financial decisions. Stop losses should be an important part of any investment in equity.
NH trade ideas

Narayana Hrudayalaya - Strong Fundamental & TechnicalFundamental plus Technical Analysis on a Financially Strong Company:
Narayana Hrudalaya Ltd is engaged in providing economical healthcare services. It has a network of multispecialty and super specialty hospitals spread across multiple locations.
Focus
Company plans to add 700 plus beds for the next 3-4 years at Bangalore Health City. It intends to invest upto Rs. 1,000 Cr in the West Bengal for setting up a superspecialty hospital.
Capex Plan
Company has planned a total capex of 1136 Cr for FY24 and till Q3 FY24 it has spent 477 Cr.
Stock P/E - 31.7
Industry PE - 56.3
EPS growth 5Years - 67.8 %
Buy Score - 4.56 (Buy Score above 0 for me, is considered very good and above 1, excellent.)
ROCE 5Yr - 19.6 %
Please note that this idea is meant to spread awareness and should NOT be considered a buy recommendation. Do your own research before making any financial commitments.

NH : An upcoming entry Will be looking forward for an entry in this scrip if price retests the ATH. The entry will be taken with 1% risk. The target levels might vary depending on the momentum in the coming days.
Entry is invalid if the current high is taken out.
📢📢📢
If my perspective changes or if I gather additional fundamental data that influences my views, I will provide updates accordingly.
Thank you for following along with this journey, and I remain committed to sharing insights and updates as my trading strategy evolves. As always, please feel free to reach out with any questions or comments.
Other posts related to this particular position and scrip, if any, will be attached underneath. Do check those out too.
Disclaimer : The analysis shared here is for informational purposes only and should not be considered as financial advice. Trading in all markets carries inherent risks, and past performance is not indicative of future results. It’s essential to conduct your own research and assess your risk tolerance before making any investment decisions. The views expressed in this analysis are solely mine. It’s important to note that I am not a SEBI registered analyst, so the analysis provided does not constitute formal investment advice under SEBI regulations.

narayan hrugnalay chart shows its stability,any dips can be goodif come near trendline support or in demand zone near 1350 would be good level for the stock
#NH , 1D and 1W Bullish Pattern
Looks Very Good in Weekly And Daily Time Frame , It is Ready for Breakout from Pattern .
It has Repeated the same pattern in Past so High chances to go up .
if u find this Chart Helpful pls like and Follow for More like this charts .
I am A Swing Trader , Trade only Price Action Patterns .

Narayana HridalayaBuy and add any dips for Medium - Long Term.
Target 2100.
Some Resistance at 1400 & Support around 1246 - 1300.
I am not SEBI Registered.

Stock Analysis – Narayana Hrudayalaya Ltd. (NH)📅 Date: January 30, 2025
📊 Timeframe: Daily Chart
📌 Market Snapshot
Change: +82.95 points (+6.36%)
Volume: 422.71K vs 295.96K (Above average volume, indicating strong interest)
Momentum Indicators: RSI breakout
Candle Pattern: Strong Bullish Candle
⚡ Levels to Watch
🔴 Key Resistance Zones (Above Current Price)
🚀 1,425.98 – Immediate hurdle
🚀 1,464.82 – Next breakout zone
🚀 1,527.78 – Major supply area
🟢 Key Support Zones (Below Current Price)
🔻 1,324.18 – Short-term support
🔻 1,261.22 – Key demand zone
🔻 1,222.38 – Strong base
🚀 Conclusion
Narayana Hrudayalaya Ltd. is showing strong bullish momentum with an RSI breakout and a powerful bullish candle. The stock is in an uptrend, and the volume above the average suggests robust buying interest. A key focus will be on whether the price can sustain above the support zones to confirm further upward momentum.
Could the price hold above the support levels and continue the bullish trend towards the resistance zones?

NARAYANA HRUDAYALAYA LTD S/RSupport and Resistance Levels:
Support Levels: These are price points (green line/shade) where a downward trend may be halted due to a concentration of buying interest. Imagine them as a safety net where buyers step in, preventing further decline.
Resistance Levels: Conversely, resistance levels (red line/shade) are where upward trends might stall due to increased selling interest. They act like a ceiling where sellers come in to push prices down.
Breakouts:
Bullish Breakout: When the price moves above resistance, it often indicates strong buying interest and the potential for a continued uptrend. Traders may view this as a signal to buy or hold.
Bearish Breakout: When the price falls below support, it can signal strong selling interest and the potential for a continued downtrend. Traders might see this as a cue to sell or avoid buying.
20 EMA (Exponential Moving Average):
Above 20 EMA(50 EMA): If the stock price is above the 20 EMA, it suggests a potential uptrend or bullish momentum.
Below 20 EMA: If the stock price is below the 20 EMA, it indicates a potential downtrend or bearish momentum.
Trendline: A trendline is a straight line drawn on a chart to represent the general direction of a data point set.
Uptrend Line: Drawn by connecting the lows in an upward trend. Indicates that the price is moving higher over time. Acts as a support level, where prices tend to bounce upward.
Downtrend Line: Drawn by connecting the highs in a downward trend. Indicates that the price is moving lower over time. It acts as a resistance level, where prices tend to drop.
RSI: RSI readings greater than the 70 level are overbought territory, and RSI readings lower than the 30 level are considered oversold territory.
Combining RSI with Support and Resistance:
Support Level: This is a price level where a stock tends to find buying interest, preventing it from falling further. If RSI is showing an oversold condition (below 30) and the price is near or at a strong support level, it could be a good buy signal.
Resistance Level: This is a price level where a stock tends to find selling interest, preventing it from rising further. If RSI is showing an overbought condition (above 70) and the price is near or at a strong resistance level, it could be a signal to sell or short the asset.
Disclaimer:
I am not a SEBI registered. The information provided here is for learning purposes only and should not be interpreted as financial advice. Consider the broader market context and consult with a qualified financial advisor before making investment decisions.n


NH : 🎯Must in the Watchlist🎯 The best-ever quarter results - Q2FY24
🎯 The Price Action is favorable
The chart is pretty self-explanatory as always :)
If you'd like to request an educational analysis, simply send us 100 coins as a token, and we'll be happy to post one for you.
⚠️Disclaimer: We are not registered advisors. The views expressed here are merely personal opinions. Irrespective of the language used, Nothing mentioned here should be considered as advice or recommendation. Please consult with your financial advisors before making any investment decisions. Like everybody else, we too can be wrong at times ✌🏻


BEHATREEN STOCK FOR LONG TERM iNVESTMENT K LIENarayana Hrudalaya Ltd is engaged in providing economical healthcare services. It has a network of multispecialty and super specialty hospitals spread across multiple locations.
Market Cap
₹ 14,884 Cr.
Current Price
₹ 728
High / Low
₹ 820 / 588
Stock P/E
33.4
Book Value
₹ 88.1
Dividend Yield
0.14 %
ROCE
24.7 %
ROE
26.7 %
Face Value
₹ 10.0
Debt
₹ 858 Cr.
EPS
₹ 21.8
PEG Ratio
1.02
Promoter holding
63.8 %
Intrinsic Value
₹ 303
Pledged percentage
0.00 %
EVEBITDA
18.5
PROS:-
Company has delivered good profit growth of 32.8% CAGR over last 5 years
Company's median sales growth is 21.4% of last 10 years
CONS:-
Stock is trading at 8.27 times its book value
Company has a low return on equity of 13.3% over last 3 years
Overall behatreen company hai investment k lie isme kai mutual funds ne bhi stake le rkha h and stock looking good on chart also. Target ki bat kru to 1000+ target hum ane wale 1 sal tak dekh skte hain,,,stock loss lagane jaisa kuch h n isme jitna niche aye kharidne me he faeda hoga long term me. fir stop loss 650 ka laga lo agar lena h to.
Please guy's like and follow me if you really like my work.
Thankyou

Narayana Hrudayalaya Ltd.A possible weekly breakout candidate. Keep on radar can breakout this week for a long entry.

Narayana Hrudayala All Time High Breakout after VCP All Time HIGH Breakout
Weekly Consolidation at ATH
Breakout with Volumes
VCP on Daily Chart
Fundamentally Strong


NHThese are swing idea's which you can add your watchlist and analysis for yourself.
Keep on radar.
Potential upside stock!
This content for only education purpose!
I am not SEBI Register.

NARAYANA HRUDAYALA FRESH BREAKOUT NARAYANA HRUDAYALA FRESH BREAKOUT
Buy For Target 1200 in swing trading
Stop loss 1000
For Everyday Updates follow.

Narayana Hrudayalaya Ltd Bullish View📈🚀 Exciting News for Narayana Hrudayalaya Ltd.! 🚀📈
Narayana Hrudayalaya Ltd. is showing strong bullish signs with the potential to reach Rs. 1200 or even higher! 📈🤑
🚩 Flag & Horizontal Breakout: The stock has witnessed a significant flag and horizontal breakout pattern, accompanied by robust trading volume, signaling a potential upward trend. 📈📊
📈 RSI Cross 60: The Relative Strength Index (RSI) has crossed the crucial 60-level mark, indicating increased buying momentum and investor confidence. 📊📈
💹 MACD Crossover: The Moving Average Convergence Divergence (MACD) has displayed a bullish crossover, which is a strong buy signal for traders and investors alike. 📈📉
Investors, keep a close eye on Narayana Hrudayalaya Ltd. as it seems poised for an exciting journey ahead! 🚀💰 #NarayanaHrudayalaya #BullishTrend #StockMarket 📈🤑📊
Disclaimer: Remember to conduct thorough research and consult with a financial advisor before making any investment decisions. 🧐💼💰 #StockAnalysis #CampusFootwear #InvestingOpportunity

Narayana hrudayalaya may go 1200Sideways consoldn breakout
Volume pickin up
1100..1200 next targets
Stop.. 1020

NH Seems to be bullish in upcoming weeksNarayana Hrudayalaya (NH) Seems to be bullish in upcoming weeks
Stock Recommendation: Narayana Hrudayalaya (NH)
Buy Price: 1005 - 1015
Sell Price: Target 1 with 3% profit
Target 2 with 5% profit
Target 3 with 9% profit

Trying ATH but facing resistance Gratify if you appreciate the practice then you can like it, share it and
If you want me to investigate any chart for you then would cherish doing that for you.
Thank you for your time and support.
Stay safe.

NH CMP 739... trending stock on long term timeframeNH CMP 739...trending stock on long term timeframe irrespective of market conditions...looks like heading towards 870+...purely positional once breakout 770 with SL of 730 on closing basis....presently conversing triangle...higher probablity of breakout on upside.. Fundamentally also looking good..
