#NiftyBees - What does it Say?Date: 29-05-2025
#NIFTYBEES Current Price: 277.50
#NIFTYBEES Pivot Point: 279.6
Upside Targets: 291.81 298.01 304.91 311.82
Downside Targets: 267.39 261.17 254.26 247.35
Support: 273.61
Resistance: 285.61
Key stats
About NIPPON INDIA ETF NIFTY BEES
Home page
Inception date
Dec 28, 2001
Structure
Open-Ended Fund
Replication method
Synthetic
Primary advisor
Nippon Life India Asset Management Ltd. (Invt Mgmt)
ISIN
INF204KB14I2
The investment objective of Nippon India ETF Nifty BeES is to provide investment returns that, before expenses, closely correspond to the total returns of the Securities as represented by the Nifty 50 Index. There can be no assurance or guarantee that the investment objective of the Scheme will be achieved.
Related funds
Classification
What's in the fund
Exposure type
Finance
Technology Services
Energy Minerals
Stock breakdown by region
Top 10 holdings

DailyTrade Daily TradeDaily TradeDaily TradeDaily TradeDaily Trade
Daily TradeDaily TradeDaily Trade

Trade or Invest -ETF are best. ETF performances since 2023 . Low Risk and high returns Instruments.
At current stage ETF to watch & Invest is IT & Bank.
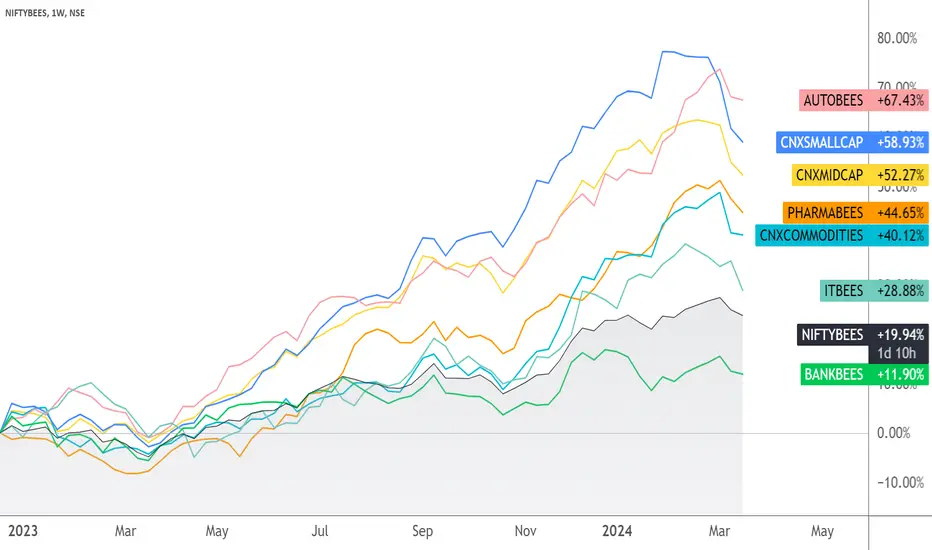
Indian Mutual Funds against S&P500Been sick and tired of people talking about how amazing developing economies' stock performances are. So I created a custom chart which displays the performance of Indian Stock Market (tracked by an ETF) denominated in USD, and mapping it against S&P500.

NIFTYBEES : Booked a profit of 3.37%Expecting a reversal move in Nifty. A detailed post regarding the same is attached underneath this post.
So booked profit in NIFTYBEES for about 3.37% of the invested capital. Since about 5% of the capital was involved in this trade, the % gain on the whole capital is high although the % gain on t


Investment accumulationNifty down .. As per daily chart, nifty stand at gap up region. if go down then possibly up to 14200 but don't known where..this is uncertainty .. so just buy Nifty bees slowly . every dip buy up to December... I trust on indian economy that's why buy .....


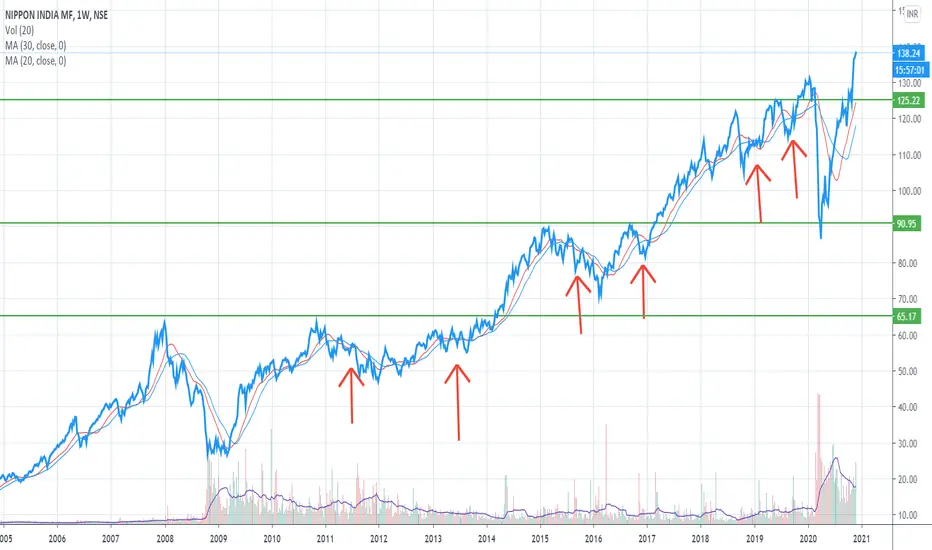
Nifty ETF - Collectible ApproachNifty ETF has show an interesting trend. It does not stay below a 30 Week MA for long period and those are the days of collecting it in loads. Except the 2011-13 period - the most boring investment period, Nifty ETF keeps on its Long Only Trend intact.
DISC: Not a SEBI Registered. I post charts for

See all ideas
Summarizing what the indicators are suggesting.
Oscillators
Neutral
SellBuy
Strong sellStrong buy
Strong sellSellNeutralBuyStrong buy
Oscillators
Neutral
SellBuy
Strong sellStrong buy
Strong sellSellNeutralBuyStrong buy
Summary
Neutral
SellBuy
Strong sellStrong buy
Strong sellSellNeutralBuyStrong buy
Summary
Neutral
SellBuy
Strong sellStrong buy
Strong sellSellNeutralBuyStrong buy
Summary
Neutral
SellBuy
Strong sellStrong buy
Strong sellSellNeutralBuyStrong buy
Moving Averages
Neutral
SellBuy
Strong sellStrong buy
Strong sellSellNeutralBuyStrong buy
Moving Averages
Neutral
SellBuy
Strong sellStrong buy
Strong sellSellNeutralBuyStrong buy
Displays a symbol's price movements over previous years to identify recurring trends.
Frequently Asked Questions
An exchange-traded fund (ETF) is a collection of assets (stocks, bonds, commodities, etc.) that track an underlying index and can be bought on an exchange like individual stocks.
NIFTYBEES trades at 277.42 INR today, its price has fallen −0.74% in the past 24 hours. Track more dynamics on NIFTYBEES price chart.
NIFTYBEES price has fallen by −3.00% over the last month, and its yearly performance shows a −0.11% decrease. See more dynamics on NIFTYBEES price chart.
NAV returns, another gauge of an ETF dynamics, showed a 9.84% increase in three-month performance and has increased by 19.99% in a year.
NAV returns, another gauge of an ETF dynamics, showed a 9.84% increase in three-month performance and has increased by 19.99% in a year.
NIFTYBEES fund flows account for 7.29 T INR (1 year). Many traders use this metric to get insight into investors' sentiment and evaluate whether it's time to buy or sell the fund.
Since ETFs work like an individual stock, they can be bought and sold on exchanges (e.g. NASDAQ, NYSE, EURONEXT). As it happens with stocks, you need to select a brokerage to access trading. Explore our list of available brokers to find the one to help execute your strategies. Don't forget to do your research before getting to trading. Explore ETFs metrics in our ETF screener to find a reliable opportunity.
NIFTYBEES invests in stocks. See more details in our Analysis section.
NIFTYBEES expense ratio is 0.05%. It's an important metric for helping traders understand the fund's operating costs relative to assets and how expensive it would be to hold the fund.
No, NIFTYBEES isn't leveraged, meaning it doesn't use borrowings or financial derivatives to magnify the performance of the underlying assets or index it follows.
In some ways, ETFs are safe investments, but in a broader sense, they're not safer than any other asset, so it's crucial to analyze a fund before investing. But if your research gives a vague answer, you can always refer to technical analysis.
Today, NIFTYBEES technical analysis shows the sell rating and its 1-week rating is buy. Since market conditions are prone to changes, it's worth looking a bit further into the future — according to the 1-month rating NIFTYBEES shows the buy signal. See more of NIFTYBEES technicals for a more comprehensive analysis.
Today, NIFTYBEES technical analysis shows the sell rating and its 1-week rating is buy. Since market conditions are prone to changes, it's worth looking a bit further into the future — according to the 1-month rating NIFTYBEES shows the buy signal. See more of NIFTYBEES technicals for a more comprehensive analysis.
No, NIFTYBEES doesn't pay dividends to its holders.
NIFTYBEES trades at a premium (0.06%).
Premium/discount to NAV expresses the difference between the ETF’s price and its NAV value. A positive percentage indicates a premium, meaning the ETF trades at a higher price than the calculated NAV. Conversely, a negative percentage indicates a discount, suggesting the ETF trades at a lower price than NAV.
Premium/discount to NAV expresses the difference between the ETF’s price and its NAV value. A positive percentage indicates a premium, meaning the ETF trades at a higher price than the calculated NAV. Conversely, a negative percentage indicates a discount, suggesting the ETF trades at a lower price than NAV.
NIFTYBEES shares are issued by Nippon Life Insurance Co.
NIFTYBEES follows the Nifty 50. ETFs usually track some benchmark seeking to replicate its performance and guide asset selection and objectives.
The fund started trading on Dec 28, 2001.
The fund's management style is passive, meaning it's aiming to replicate the performance of the underlying index by holding assets in the same proportions as the index. The goal is to match the index's returns.