NTPC all targets done in styleNTPC breakout near 94 and hit all targets done in style.. gave near 14% returns in 16 days.. updating late
NTPC trade ideas


NTPC CMP 98.55NTPC CMP 98.55, Can go to 107 and 114 by Jan 21 with a sl of 92. It is purely for educational purpose and consult your financial adviser for any investment decision.

NTPC- CMP 102.4 - UpdateNTPC CMP-102.4, Channel breakout. On last working day it made huge volumes of around 2.5 times previous volumes with a price rise of 5% and OI rise of around 2%. MACD and RSI are also indicating positive. Option chain indicates good support at 100 as calls are cut and puts are added till 100 significantly and also reduction in calls are happening at 105 also. It can go up to 107, 116.8 in near term with a SL of 96. It is purely educational purpose and any investment made shall be after consultation with financial advisers.


overall uptrend but shot term targett 95 then upweak in short term, might touch 95 and then again will test 100 and if able to cross then up up


NTPC on verge of break outNTPC on verge of break out of channel. Volumes in Last trading session are huge along with good future OI build up. It taken support at 9 EMA intraday and went up. Can be bought at support of 9 EMA and can wait for break out, can look for a target of 100 and 108 in near term with a sl of 87.

NTPC looks good for short termNTPC formed cup and handle pattern.. looks good for short term.. safe can buy above 97.. keep sl as per ur setup

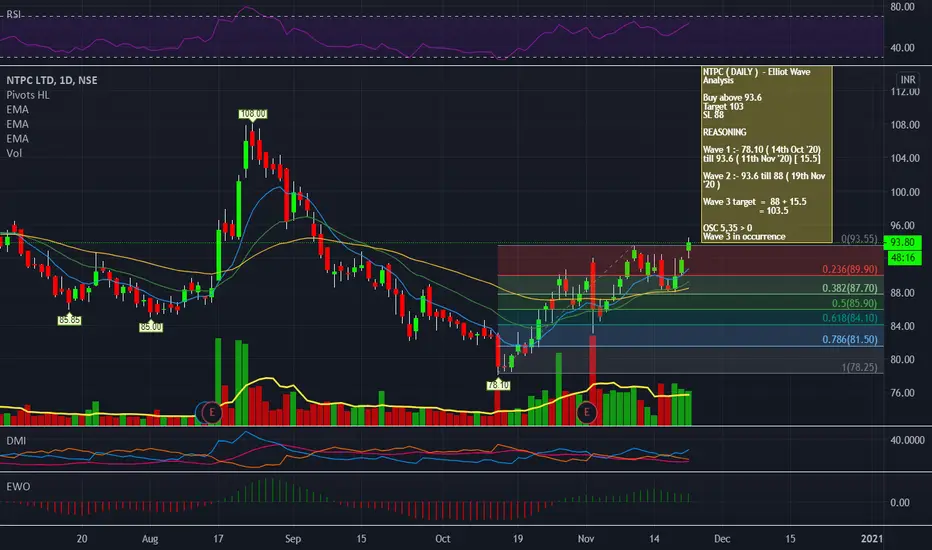
NTPC ( DAILY ) - Elliot Wave AnalysisNTPC ( DAILY ) - Elliot Wave Analysis
Buy above 93.6
Target 103
SL 88
REASONING
Wave 1 :- 78.10 ( 14th Oct '20) till 93.6 ( 11th Nov '20)
Wave 2 :- 93.6 till 88 ( 19th Nov '20 )
Wave 3 target = 88 + 15.5
= 103.5
OSC 5,35 > 0
Wave 3 in occurrence
NTPC Inverse Head and ShouldersAn inverse Head and Shoulder already formed in NTPC and now its consolidating which is usually a good sign, do keep this stock in your watchlist .

NTPC ( SWINGTRADE)here we see inverted Head & Shoulder Pattern. by which we estimate that in upcoming trading sessions..... there is the upward move !!! this estimation based on Price Action and Patterns.

NTPC SHORTit has formed a head and shoulders pattern on 15min timeframe, rejecting the above resistance around 90, can look for shorting opportunity around its neckline which is at 87.40, or can short around level of 87 from where there is a gap stretching till 86 which can be filled out if it shows bearish signal and follows the pattern

#NTPC #NSE #BSE #NIFTY #BANKNIFTY #IoT #ML #AI #TRUMP #ELECTIONS#NTPC
NTPC Ltd.
CMP: 86.25
Target: 95
SL: 80
If u like my work, kindly LIKE SHARE & FOLLOW for latest recommendations.


[EMA RETEST] NTPC SHORT RISKYema being retested but not broken
shorting 84CE @ 1.3
buying 85CE @ 1.1

NTPC seems to getting Accumulated by stronger hands.Stocks has been in downtrend and slowly being accumulated. Operators (Stronger hands) are trying to trigger panic and take out retailers. Stocks should be bought with SL of close below 72 for long term to Mid term holding.


NTPC (Will the stock finally give up on going up ?)NTPC has been forming a triangle more of its been respecting 2 trend lines as shown in the chart. Any breach of the same should give a good momentum move.
Prices have been testing a very crucial zone and a continuous weak momentum can be bad for the stock. However any breach to the upside from a consolidation at such a level can take the price to higher levels. We have seen how over the previous day it has made a very compact channel. People looking to trade intraday can look to trade the breach of the same as well.
We need to keep in mind that volatility has been growing in for a while now and movements can be wild. As of today morning there was news of Donald Trump and the First Lady being tested positive for Corona Virus which caused the US Futures to tumble upto 1.5% and SGX Nifty followed suit. With fast approaching US election Volatility is not going to be subdued and is going to constantly cause wild movements.
I would suggest having strict stop loss and avoiding carry forward of positions without a hedge as it can wash out a traders capital in a day.
Trade with Caution.

