OIL INDIA BUY VIEW OIL INDIA - BUY PROJECTION
Trade Setup :
Fundamental Analysis
Stock PE - 9.22
Industry PE - 20.7
Low Debt
Promoter Holding - 53 %
DII Holdings - 17 %
Regularly Paid Dividend - 2 %
Strong Fundamental - Stock Possible to Doubled - (Current - 474 ) (Target - 948 )
for Long term 5 years Holding ..
Technical Analysis
Monthly - Strong Support & Fib 50 %
Day - Wait For Candle Close in Black Line
Entry - 507 Rs
Target - 740 Rs
Stoploss - 408 Rs
Happy trading .. Thank You ...
OIL trade ideas

OIL LONG_Support @ 20/50/ 200 Daily EMAOIL Long:
- Price takes support at 20/50/ 200 Daily EMA
- Forms Higher low & movement shows good Volume
- Enter Long when the prices are favorable in the lower timeframe
- Target: 485
- SL: Close below 20 Daily EMA or today's low

OIL Range Breakout with Strong Volume Confirmation Timeframe: Daily (1D)
📌 Chart Observed: Appears to be a stock forming higher lows after a strong recovery from
bottom.
🔍 Pattern Noticed:
• Price breakout above 200 EMA – typically a strong trend reversal signal.
• Today’s candle shows a bullish engulfing move with a volume spike, indicating buyer interest.
• RSI bouncing from 50 zone – suggests momentum revival.
📊 Volume: Higher than last 10-day average, confirming breakout interest.
🧭 Support Zone: ~₹425–₹430
🚀 Potential Upside (If trend continues): ₹470–₹500 zone
⚠️ Caution: Avoid entry if price falls below 200 EMA again or if volume fades on follow-up candles.
⸻
📌 Disclaimer:-
“I am not a SEBI registered advisor. This is just my personal analysis shared for educational and observational purposes. Please consult your financial advisor before making any trading or investment decisions.”

OIL INDIA - FOR SWING AND INTRADAY TRADEOil india is looking good in its Daily time frame.
Today price has given a breakout in Daily time frame.
Current closing price is 465 next target can be 490.

OIL - LONG TERM ANALYSISThanks for stopping by.
All analysis here is done strictly from an investor’s perspective — focusing on risk, return, valuation, and potential upside.
The notes cover key details. I’ve backed every thesis with my own analysis — no fluff, just what matters to investors.
If you find the idea useful or have suggestions, feel free to leave a comment. Always open to fresh insights.
Kind regards,
Psycho Trader

OIL – Oil India Ltd | Target: ₹429.00🟢 Trade Details:
LTP: ₹417.30
Recommended Buy Range: ₹415.50 – ₹416.00
🎯 Target: ₹429.00
🛑 Stop Loss: ₹408.70
🔍 Technical Snapshot:
✅ Strong bullish candle with volume confirmation
✅ EMA crossover supports the uptrend (9 EMA > 13 EMA)
✅ RSI at 62.22 shows healthy momentum
✅ Breakout above previous range box visible on Daily & 1H TF
📊 BB %B at 0.82 – still room before overbought levels
💼 Strategy:
Suitable for short-term MTF holding (2–5 days)
Risk-Reward ~1:1.5
Trail SL to cost once ₹424+ is breached
Use smaller timeframes (15m / 1H) to confirm entry with volume
For Education Purposes Only

OIL INDIASure! Here are all three English translations together:
---
This chart is of OIL INDIA LTD (NSE: OIL) in the daily timeframe (1D).
If this breakout is strong, it could be a sign of a bullish reversal.
If the price holds above the channel (above 405), it could be a good buy signal. However, if it fails and re-enters the channel, the stock may decline further.
If you find this helpful and want more FREE forecasts in TradingView, Hit the 'BOOST' button
Drop some feedback in the comments below! (e.g., What did you find most useful?
How can we improve?)
Your support is appreciated!
Now, it's your turn!
Be sure to leave a comment; let us know how you see this opportunity and forecast.
Have a successful week
DISCLAIMER: I am NOT a SEBI registered advisor or a financial adviser. All the views are for educational purpose only

OIL INDIA LTD• CMP: ₹378| Stop Loss: ₹405 Target:*310
DISCLAIMER: I am NOT a SEBI registered
advisor or a financial adviser. All the views are for educational purpose only.

OIL India Ltd Short TradeHello,
Trend-Based Analysis. Buy the Dips, Sell The Rallies, Also Following the Trend. Let's see where the Price Action takes us, Riding the wave. Potential trade setups based on trend momentum.
Technical analysis based on trend identification and momentum, Looking for high-probability setups within the prevailing trend.
Analyzing the current market trend and potential future price movement. Focusing on risk management and reward-to-risk ratios.
Details is Mentioned in Chart, Read carefully.. .
oilindia - Ema 100 > 144 > 200 > 300oilindia - Ema 100 > 144 > 200 > 300
1) Strong wide base formation
2) Bigger time frame Overall trend is upside
3) On DTF consolidation is goin on
4) Wide Consolidation going on
5) wait for trap breakdown till green ema
Expect stock to rally at least 40 % there after.

Oil India Ltd view for Intraday 7th Nov #OIL Oil India Ltd view for Intraday 7th Nov #OIL
Resistance 530. Watching above 531 for upside movement...
Support area 520. Below 525-520 ignoring upside momentum for intraday
Support 520 .Watching below 519 for downside movement...
Resistance area 530
Above 525-530 ignoring downside move for intraday
Charts for Educational purposes only.
Please follow strict stop loss and risk reward if you follow the level.
Thanks,
V Trade Point3

W pattern in daily chart W pattern in daily chart with macd diversion confirmed buying is in trend
Target would be 612 next level on fibs.

OIL S/RSupport and Resistance Levels:
Support Levels: These are price points (green line/shade) where a downward trend may be halted due to a concentration of buying interest. Imagine them as a safety net where buyers step in, preventing further decline.
Resistance Levels: Conversely, resistance levels (red line/shade) are where upward trends might stall due to increased selling interest. They act like a ceiling where sellers come in to push prices down.
Breakouts:
Bullish Breakout: When the price moves above resistance, it often indicates strong buying interest and the potential for a continued uptrend. Traders may view this as a signal to buy or hold.
Bearish Breakout: When the price falls below support, it can signal strong selling interest and the potential for a continued downtrend. Traders might see this as a cue to sell or avoid buying.
20 EMA (Exponential Moving Average):
Above 20 EMA: If the stock price is above the 20 EMA, it suggests a potential uptrend or bullish momentum.
Below 20 EMA: If the stock price is below the 20 EMA, it indicates a potential downtrend or bearish momentum.
Trendline: A trendline is a straight line drawn on a chart to represent the general direction of a data point set.
Uptrend Line: Drawn by connecting the lows in an upward trend. Indicates that the price is moving higher over time. Acts as a support level, where prices tend to bounce upward.
Downtrend Line: Drawn by connecting the highs in a downward trend. Indicates that the price is moving lower over time. It acts as a resistance level, where prices tend to drop.
RSI: RSI readings greater than the 70 level are overbought territory, and RSI readings lower than the 30 level are considered oversold territory.
Combining RSI with Support and Resistance:
Support Level: This is a price level where a stock tends to find buying interest, preventing it from falling further. If RSI is showing an oversold condition (below 30) and the price is near or at a strong support level, it could be a good buy signal.
Resistance Level: This is a price level where a stock tends to find selling interest, preventing it from rising further. If RSI is showing an overbought condition (above 70) and the price is near or at a strong resistance level, it could be a signal to sell or short the asset.
Disclaimer:
I am not a SEBI registered. The information provided here is for learning purposes only and should not be interpreted as financial advice. Consider the broader market context and consult with a qualified financial advisor before making investment decisions.

52 Week High Strategy - Positional Trade Long TermDisclaimer: I am Not SEBI Registered adviser, please take advise from your financial adviser before investing in any stocks. Idea here shared is for education purpose only.
Stock is near 52 week high break out. Buy above the High and do not forget to keep stop loss best suitable for Positional Trading long Term. Keep this stock in watch list.
Target and Stop loss Shown on Chart. Initial Target Ratio 1:2. Exit only if Stock Price Close below 30 SMA on Weekly Chart.
Be Discipline, because discipline is the key to Success in Stock Market.
Trade what you See Not what you Think.

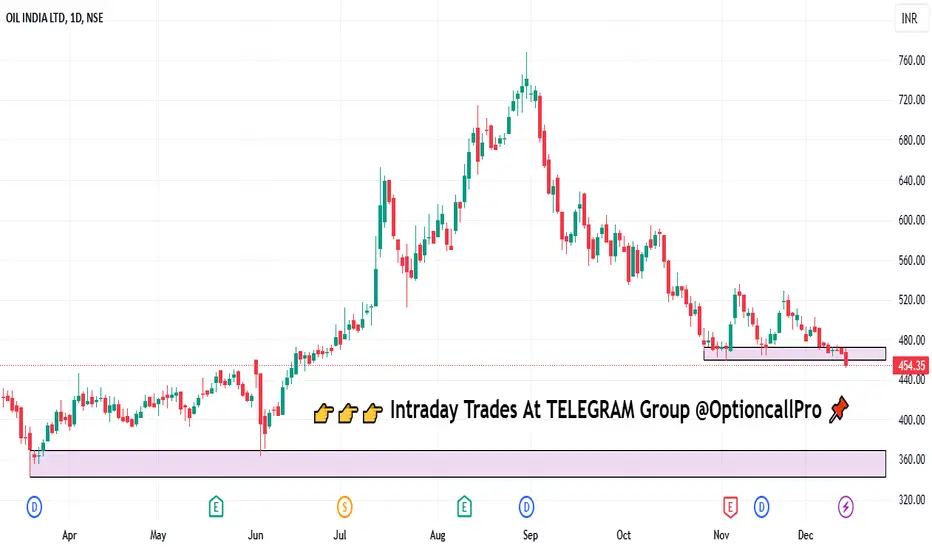
OIL India Approaching Breakout: Resistance Turns SupportOIL India Ltd is nearing a potential bullish breakout as the stock consolidates above the former resistance, now turned support, with strong volume backing the move.

OIL INDIA - swing/positional trade Entry - above 711
SL - 690
Tgt - 772, 797, 856
This is not a recommendation on buy/sell. Please consult your financial advisor before any investment.


oil indiail India is showing good relative strength compared to the general market and had good earnings in the last quarter.

Keep An Eye - Breakout Soon - OIL📊 Script: OIL
📊 Sector: Crude Oil & Natural Gas
📊 Industry: Oil Drilling / Allied Services
Key highlights: 💡⚡
📈 Script is trading near at its resistance level which is 645.
📈 Script should give closing above 645 level so that we can see good rally.
📈 Script is trading at upper band of BB.
📈 MACD and Double Moving Averages are giving crossover.
📈 Right now RSI is around 59.
📈 One can go for Swing Trade only above 645.
BUY ONLY ABOVE 645.
⏱️ C.M.P 📑💰- 636
🟢 Target 🎯🏆 - 691
⚠️ Stoploss ☠️🚫 - 625
⚠️ Important: Always maintain your Risk & Reward Ratio.
✅Like and follow to never miss a new idea!✅
Disclaimer: I am not SEBI Registered Advisor. My posts are purely for training and educational purposes.
Eat🍜 Sleep😴 TradingView📈 Repeat 🔁
Happy learning with trading. Cheers!🥂

OIL Short Term2-2-2024
------------
Buy OIL @ CMP
for the Target of 483.80-526.55
SL 390
Strategy : SBO + RSI > 60 + EMA above 20 & 50
Duration few Days

Oil India channel breakout Oil India channel breakout on chart, will go further up if volumes support. Keep an eye on volumes

Clear breakout in weekly timeframeBroken it's previous resistance with good candle. It's good to buy this now or in retracement. It's only my view not a recommendation.

MY TRADE CONTINUES Another stock for year 2024 i.e second stock for New year ...
Mentioned the stock earlier in my profile and now again gave a strong breakout with the great volumes as the stock passed the defined previous target of 350 ..
Cmp 373
Buy around 255-265
Target: 500-600+
SL : 240 ( will not be active for sure )
Pro's and cons mentioned in earlier analysis but still a good fundamental stock with P/E increased to 6 from 3 ..
Note : It's my own analysis and not any personal recommendations to buy or sell the stock . Do your own analysis before taking any risk ..
