PERSISTENTNSE:PERSISTENT
Corrected Stock
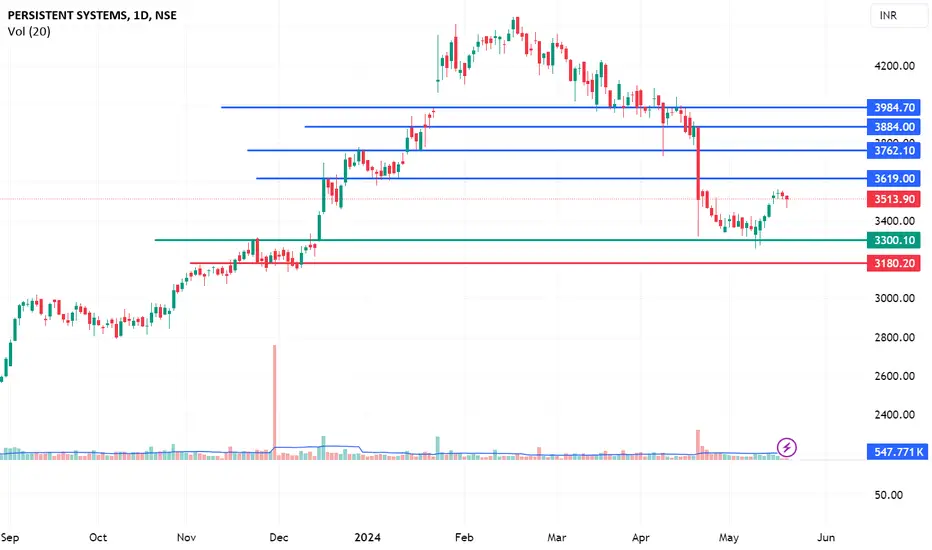
Risky Trade
Rsi>50
support@3300
Buy and add on deep till 3300
Sl- 3180 on Closing basis
Target- 3619/3762/3884/3984
Idea is only for educational purpose
PERSISTENT trade ideas
persistant There is a good possibility that wave 4 is done and next wave can start from here for this script as per the fib ratio, EW analysis and channel pattern. This could be a good point of good risk reward ratio.

buy at 0.58 lvl.looking for reversal in 0.58 fib level . my sl would is candle close below 3131.90
entry price is 3212.95 . lets see wat happens.

What Next in $NSE:PERSISTENT ?Dear Followers,
I hope this message finds you well. I wanted to provide you with a brief update on the stock NSE:PERSISTENT I have been monitoring.
It appears that the stock is approaching a potential resistance level Near 8750-8800 This is an important technical point where the price has historically had difficulty breaking through. It suggests that we may see a temporary halt in the current upward momentum and Possibly it will test 7800 In Downmove.
Option Trader Can Keep Track 8500 PE FEB.
Resistance Levels to Watch out.
Resistance levels are the opposite, representing prices at which a stock has historically struggled to move above. These levels can signal a selling interest. Understanding resistance points is crucial for anticipating potential obstacles in the upward movement of a stock.
R1= 8800
R2= 9100
R3= 9450
Support Levels To Watchout.
Support levels represent prices at which a stock has historically had difficulty falling below. These levels often indicate a strong buying interest. It's important to monitor these levels, as a breach might suggest a potential downward trend.
S1= 8450
S2= 8150
S3= 7800
As always, please remember that investing involves risks, and it's important to carefully consider your options. If you have any questions or would like to discuss this further, please don't hesitate to reach out.
Best regards,


Let see how much fuel it has nowPersistent system.
Abiding by the rules of Elliott wave.
Now it interesting to see how much fuel it has for further moves.
no recommendation pls.


PERSISTENT ( STRONG BREAK OUT)Persistant looking very strong also given break out in previous session.
Breakout with elephant candle which shows some big fishes are buying the stock.
volume are also gud buy on this price.
SL 5860
Risk reward ratio and probability is only the holy grail in the market.
Dont lose more than your entry reason.

Inverse Head and shoulder, Flag pole pattern Persistent systemsIn this script we see nice Inverse head and shoulders pattern, Flag and pole patterns.
The retracement or pull back or profit booking took the stock back to 38.2 levels in Fibonacci retracement. As script has revered from 38.2 levels its considered as a shallow correction. Any up move after the breakout is sharp and can help in achieving targets faster.
As per the flag height or height of head the targets come out to be near 7500 levels.
stop loss for such aggressive targets can be near 3900 levels.

My view on Persistent Double bottom breakout possible in Persistent
Above 6535-38
Looking tgt 6600-6620++ in very short term.
We will add on dip.
Keeping on radar Persistent 6600 CE

PERSISTENT Very strong chart setup for create long position stock price at all time high
20 DEMA good support
Go for long
On chart top hanging man candle if price break today high then enter otherwise no long trade.
Disclaimer This is my personal view for education purpose only
No Buy sell recommendations.

PERSISTENT NSE:PERSISTENT
One Can Enter Now !
Or Wait for Retest of the Trendline (BO) !
Or wait For better R:R ratio !
Note :
1.One Can Go long with a Strict SL below the Trendline or Swing Low.
2. R:R ratio should be 1 :2 minimum
3. Plan as per your RISK appetite and Money Management.
Disclaimer : You are responsible for your Profits and loss, Shared for Educational purpose

Bullish chart 1)Chart it self showing bullish chart
2) symetrical triangle breakout
3) valume high compared to previous 2-3 months
4) stock breakout 6000 sentimental resistance
5) sustain above previous resistance 6040 level
6) no recommendation for buy and sell

breakout Stregty still put writter is active and wait for entry when one day stay above 6000 and close above 6000 so we enter the Trade and best entry is when nifty 50 is ema 200 support 200 support is 18600 so what proper good trade will be happen happy journey 5616 is first support and residence is 6000

My view on Persistent Persistent forming pole and flag
Should fly above 5940-45
Looking tgt 6000-6040-6100++
Very short term
Keeping on radar Persistent 6000 CE (Nov.)

My view on Persistent Persistent
Forming Pole & Flag
Looking tgt 6000-6030-6100++
In very short term.
Keeping on radar Persistent 6000 CE

Persistent system looking good for long term On Our Harmonic pattern indicator based trade setup take trade as explained below :-
Early trades Buy or sell below/ above 23.6 %, safe trades buy or sell above / below 41% , after taking trade next upside or downside levels will be target ,
When reverse buy or sell signal appear then book profit on Target or trail SL to 23.6 % If trailing SL hit then early trade can be taken above or below 23.6 and safe trade can b taken above/ below 41% ..
Please note:-
It's working on news based and volitile market very well so exit if SL hit

PERSISTENT Systems about to break an important levelPERSISTENT at an important level ~5985.95 which appears to be rejected multiple times and also price appears to be at top after taking the retracements which is a second confirmation
We can go long if the level breaks and the first target would be the 52-week high level.
Further levels could be detected by pivots points indicator
Happy Trading :)

Big upside for PersistentThe stock has made a rounding bottom for a while, it has given a breakout from the neckline now positioning itself ready for a good upside with a favorable risk-to-reward ratio.
Entry - Between 5370-5375
Stop Loss - Below 5145
Target - 5900

PERSISTENTath
looks good for upmove.
Need to be little cautious
Only for educational purpsoe.
Not a trade recommendation.

Persistent Systems Ltd.*Persistent Systems Ltd*
P&F Formation on Yearly Basis.
C&H Formation on Monthly Basis.
Strong Price BreakOut & Sustained.
Vol. BuiltUp to be Watched.
*RSI*: 1H>D>W>M
Trail SL with Upside.
Book Profit as per Risk Appetite.
Sales / Profitability: Growing on Qtrly / Yrly Basis. Nil Debt. Growing TNW. Strong +ve CF from Ops.
Stable Promoters /FIIs Stake. DIIs Stake Increasing.
Improving RoA/RoE/RoCE: In Double Digits.
Do Your Own Research as well. This is an Opinion.
Happy Investing 😇

PERSISTENT BREAKOUT Persistent systems breakout with good volume, can do 6000-6500 in coming sessions so keep adding this stock on every dip , keep your stoploss at 5285 on daily closing basis.

PERSISTENT longPERSISTENT looks good for an immediate target of 5100. Above that we can get 5150 and 5250
A daily close below 5015 invalidates the above thesis
