Buy Pidilite above- 3000 Target- 3550 SL- 2750Pidilite Industries Limited is a leading manufacturer of adhesives and sealants, construction chemicals, craftsmen products, DIY products and polymer emulsions in India.
Most of the products have been developed through strong in-house R&D. Our brand name
Fevicol has become synonymous with adhesives to millions in India and is ranked amongst the most trusted brands in the country. Some of our other major brands are M-Seal, Fevikwik, Fevistik, Roff, Dr. Fixit, Fevicryl, Motomax, Hobby Ideas, Araldite.
Company is almost debt free.
Company has been maintaining a healthy dividend payout of 41.4%
PIDILITIND trade ideas


Bullish Flag pattern breakout in PIDILITINDUSPIDILITE INDUSTRIES LTD
Key highlights: 💡⚡
✅On 1 Hour Time Frame Stock Showing Breakout of Bullish Flag Pattern.
✅Strong Bullish Candlestick Form on this timeframe.
✅It can give movement up to the Breakout target of 3130+.
✅Can Go Long in this Stock by placing a stop loss below 2820-.

Pidilite is back breaking out of a VCPBullish on my Long term holding.. Its broken out of a consolidation above 2700 after a VCP was formed for a long time..
T1 3300
T2 3700
T3 4100


Bullish on Pidilite Broke High of Red volume Engulf candle by current candle
Selling Pressure is absorbed by current green candle
Disclaimer : it's my personal view, do your own analysis before taking any trade

PIDILITIND:: @Triangle BreakoutA strong demand is identified in this stock at 2300 levels...
facing resistance at 2800 levels...
Price is ready to breakout from this resistance levels...A traingle pattern is detected in this stock..
if price breaks this range will get sharp moment to the upside...taken the trendline support multiple times...if price breaks the bullish trendline will look for short side.
wait for the price to break upside...keep an alert in this stock at 2900 levels..
no sign of bearishness is observed in this stock.

Pidilite Industries Weekly Chart AnalysisPidilite Industries Weekly Chart looking strong and trading near breakout level .


PIDILITE ( A MONOPOLY STOCK)A fundamentally very strong stock coming near its support be watch for price action near its support. These types of monopoly stock created wealth in the past.
I will look for price action from this range if i get one big elephant candle i will buy for long term.
further information will available in comment.

My view on Pidilitind Pidilitind forming double bottom on 1 day time frame.
Giving breakout above 2796 level.
Looking tgt 2840-2860-2900++
in very short term.
Keeping on radar Pidilitind 2800 CE


PidiliteThese are swing ideas which you can add your watchlist and analysis for yourself !
Keep on your radar 📡
This content only education purpose!
❗I am not sebi ragister❗

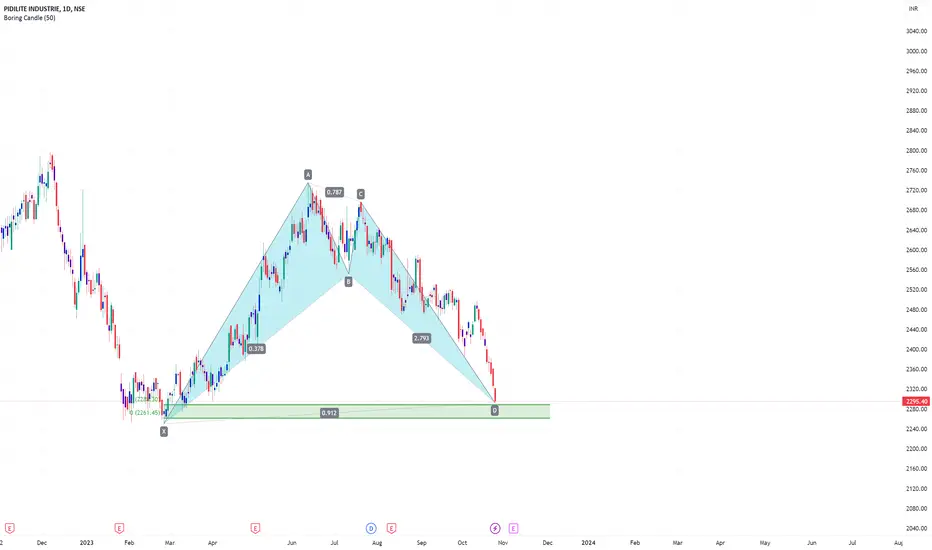
Pidilite industriesHarmonic bat pattern in 1DTF
=> Price hits reversal zone
=> Price near weekly demand zone
pidilite industries 4hr time frame buy @ 2477 target @ 2540, pidilite industries 4hr time frame
buy @ 2477 target @ 2540, 2550, 2560, 2572
decending channel breakout
risk reward 1.5
its just a view trade @ your own risk
sl@ 2413

Falling Wedge Pattern breakout in PIDILITINDPIDILITE INDUSTRIES LTD
Key highlights: 💡⚡
✅On 1Day Time Frame Stock Showing Breakout of Falling Wedge Pattern.
✅ Strong Bullish Candlestick Form on this timeframe.
✅It can give movement up to the Breakout target of 2645+.
✅Can Go Long in this stock by placing a stop loss below 2435-.

"PIDILITE's Financial Fireworks: An 8x Reward Potential Awaits"Get ready for a sizzling stock opportunity as PIDILITE gears up for a potential explosive breakout, offering an incredible 1:8 risk-to-reward ratio for savvy traders. 💪🌟
Investors, mark your calendars! 🗓️ This breakout could be the spark that ignites your portfolio to new heights. Learn how to seize breakout opportunities and make well-informed trading decisions with our in-depth analysis. 💼💡
📚 Dive into the art of stock trading and unlock the secrets of this impending breakout. Our expert analysis will guide you through the intricacies of this setup, setting the stage for potentially substantial gains. 📊💰🌟
⏳ Timing is of the essence! Position yourself strategically to maximize profits as PIDILITE approaches the breakout point. Embrace the world of stock trading and join us on this thrilling journey toward financial success. 🚀💸📈
🔔 Hit that like button if you're excited about the potential explosion with PIDILITE's breakout! Let's make this trade idea go viral, inspiring fellow traders to seize this golden opportunity in the stock market. 🌍💥💻

Pidilite ready for upside move On Our Harmonic pattern indicator based trade setup take trade as explained below :-
Early trades Buy or sell below/ above 23.6 %, safe trades buy or sell above / below 41% , after taking trade next upside or downside levels will be target ,
When reverse buy or sell signal appear then book profit on Target or trail SL to 23.6 % If trailing SL hit then early trade can be taken above or below 23.6 and safe trade can b taken above/ below 41% ..
Please note:-
It's working on news based and volitile market very well so exit if SL hit

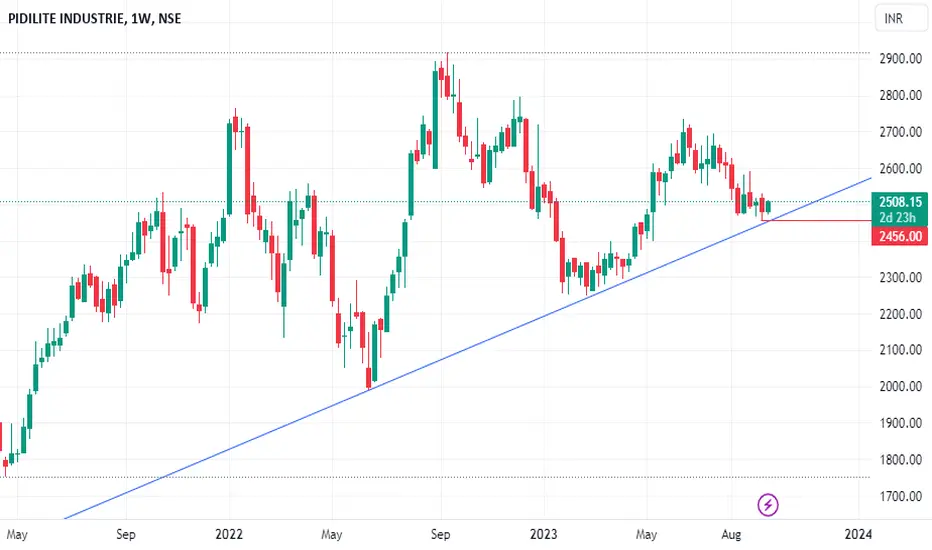
Pidilite IndustriesOn the technicals,
1) Stock price has been taking support at a Trendline formed over 4 continuous years
2) Inside candle formed in the Weekly Time Frame and price has managed to close above the 30 week moving average
3) Retracement at 0.5% of Fibanocci is on progress. (Fib levels measure from this year low)
4) Stop loss could be 4% with a target of 13% & above from current levels
On the Fundamentals,
1) PE/PB ratios are very high
2) But considerable growth shown in Sales and Profits during First quarter
I observed and highlighted some of the important points by going through technical & fundamental aspects for discussion.
Please highlight if any mistake in the above and share any important point missed out so that i would be enlightening myself in the process of analysis.

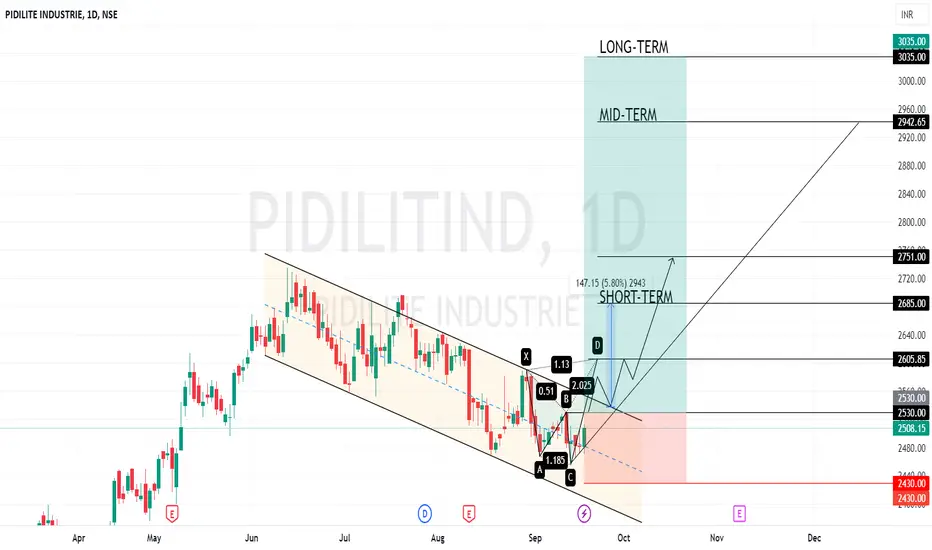
PIDILITINDPIDILITIND Chart Analysis....19/09/23
Long : Closing above 2530 lvl.
Sl : Closing below 2430
Target : 2605 / 2685 / 2750 / 2940 / 3035
Enjoy !
Pidilite Investment OpportunityThis script is at weekly support.
you can add it in your long term portfolio.
PIDILITE is on trendlinemy view on PITILITE to get in to go long at the trendline as per given limited rist of last swing/trendline breakdown.
RSI 40 on support daily timeframe and last day green candle gives long singnal
DISCLAIMER: above is my own personal view only for study purposes.

Triangle pattern breakout in PIDILITINDTriangle pattern breakout in PIDILITIND
Travelling near the Support line. More than 3 times
Short term target 6%
Long Term target 20%
