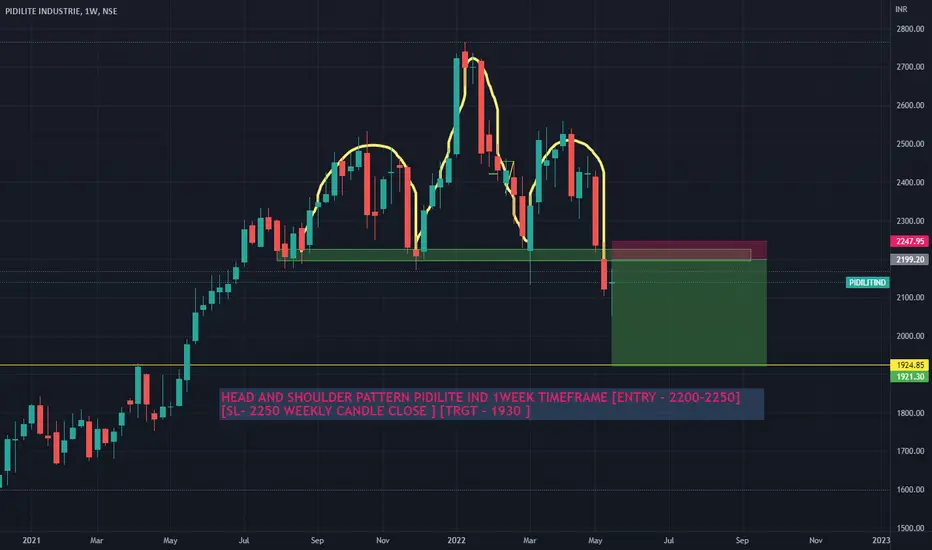
PIDILITE INDUSTRIESfevicol is forming head and shoulder pattern in weekly time frame we can accumulate puts in 2200-2250
PIDILITIND trade ideas

it making channal pattren it making channal pattren and above the 44 moving avarage line so it may go long

Symmetrical triangle Chart close crossing last week high , high delivery quantity , stock forming higher low

PIDILITE - Tight support her PIDILITE - Tight support here
Might continue upward move from here.
Maintain SL as 50 ema.


PidilitePidilite broke out of descending channel with good volumes
Could be bought with mentioned stoploss & targets.

At support. Looking good to buy.At support. Looking good to buy. very good risk to reward ratio. Generally stop loss is not necessary for such a fundamental stock.
Target as shown in chart.

#Pidilite #Pullback #StrategyPidilite simple pullback
Tgt 2520 SL 2400 buy at CMP 1:3 targets. Reason - Days Res to 50SMA

Pidilite Uop Flag FormationPIDILITE
CMP: 2700
TGT: 2750, 2815, 2870, 2920, 2990, 3090
SL: 2630
Risk Reward (RR): 1: 5.4 (Excellent)
Potential Returns : 14.25%
Potential Loss: 2.63%
Time Frame: 1-3 Weeks!

PIDILITIND Flag and Pole PatternThe stock has made flag and pole pattern. It can give a good move in coming days. Keep an eye ! This is just for educational purpose and not any investment/trading advise. Do your own analysis too.

PIDILITIND Ltd - Perfect breakout from channel Pattern🔴DISCLAIMER
***** It's just for an educational purpose and so you must also follow your own technical analysis before taking up the trade ******
Aggressive traders enter at the breakout and conservative traders may give entry after retracement (Retracement is optional, we cannot expect every stock to take a retest after the breakout, it may also continue to have its bullish pressure after the breakout)
After reaching our targets, trail your stop loss to get maximum profit from the stock in a single trade

PidilitePidilite is consolidation between range from past few trading sessions.
Today its breaking out of consolidation.
So pidilite can b bought with sloss 2207 & tgt of 2399 in 1 to 2 trading sessions.

PIDILITINDEntry 2511
Analsis
Cup and handle pattern.
Stage breakout
pick up in volumes
Trading at all time high

PidilitePidilite made an flagnpole pattern also took support @ 50% fib retracement level.
Buy with sloss 2325 & tgt of 2500

POSSIBILITY OF DOWNTREND IN PIDILITE INDUSTRIESafter a long rally, momentum in pidilite industries exhausted and the stock just started to reverse, possible to grab atleast pullback profits. this is for education and analysis purpose only.

Buy at 2421 SL 2404 TGT 2440 and 2453Based on my trendline analysis. Please do your analysis before taking any trade.

Short Term trend reversal in Pidilite IndustriesPidilite Industries after heading a long towards north, started showing exhaustion of momentum and trend reversal, the reversing trend can be a pull back or a down swing.

PIDILITE PIDILITE - Range breakout & now taking support at 50 ema.
Strong volume on buy side as well.
Looks good for decent upside.
PIDILITIND Looking Good For SwingWhat we believe in :-
°Trade With Logic
°Take Time Before Investment
Saving Your Capital 🙂
I'm not responsible for your profit or loss.
Mainly Stock & Crypto Investor 🕵️| Interim Trader 📊
DISCLAIMER :- This Channel Is For ( EDUCATIONAL PURPOSES )

pidiliteNSE:PIDILITIND
Please note that we are not a SEBI Registered Investor Adviser/PMS/ Broking House.
All the contents over here are for educational purposes only and are not investment advice or recommendations
offered to any person(s) with respect to the purchase or sale of the stocks / futures and options.
You are also requested to apply your prudence and consult your advisers in case you choose to act on
any such content available as WE claims no responsibilities for any of your actions or any outcome of
such action

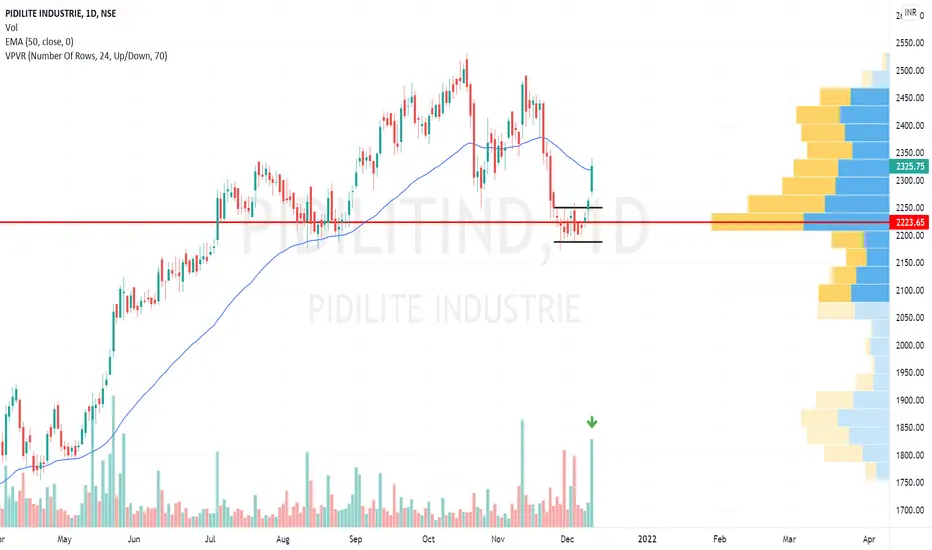
Random Stock Analysis Series - Pidilite IndustriesRandom Stock Analysis Series - Pidilite Industries
My Analysis:
------------
** Daily Timeframe **
1. Jumped in May till Jul last week.
2. Current price is at 100 MA and slightly above 200 MA - indicating that this stock is in a bearish mood.
3. Since 19th Oct 2021, it is forming an ABC correction wave from ATH of Rs.2520.
4. In this ABC correction wave, it fell 14%, in 1.5 months
5. Wave C point is marked at 1.618 Fib retracement level and likely to go up from this point of at least 10% target - marked in the chart.
6. Sellers are high in volume. The current price is the Entry point but needs two green candles in a daily timeframe to confirm and take the trade.
7. Wait for 2 green candles to enter.
Note:
I'm not recommending buying this stock. This is for education purposes.
This is my view, based on my learning.
Please do not trade without your own conviction.
Please invest after careful research. I'm not responsible for your profits/losses.
- Gnanasekaran

