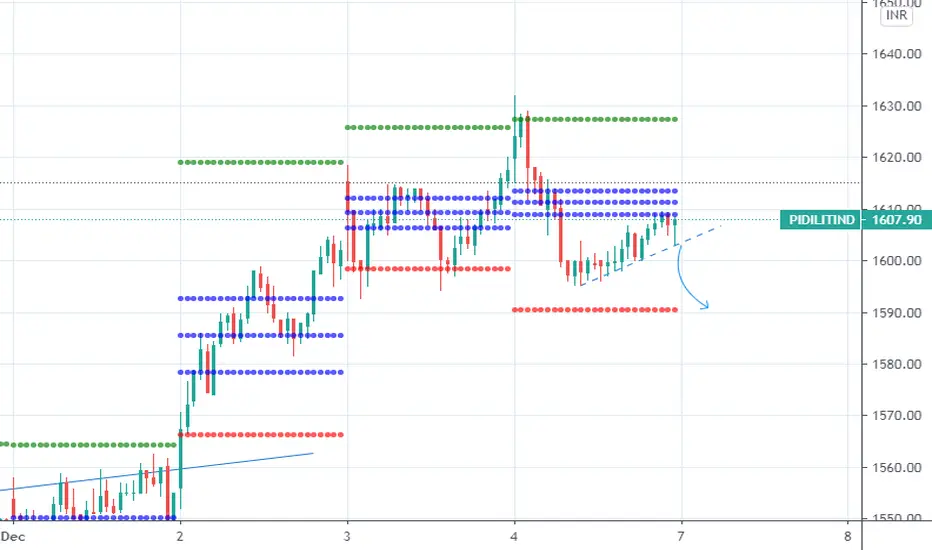
Pidilte { 15 M Long }Broke resistance in D frame & following RETEST THEORY in 15m tf.Rest is as per chart
Note :-
Entry - At the break of mentioned candle's low/high
Stop Loss -
In a Short Trade, I always use Previous Candle High ( PCH ) as a stop loss while entering the trade. Sometime I might use 15 M tf SL & trade in 30M tf which I'll mention. Vice Versa for long trades
Trailing Stop Loss ( TSL ) - Mostly I trail stop loss by PCH as price falls . I exit as PCH breaks & vice versa
Use of PSAR as TSL :- TSL get's hit in trend following due to noise, In such cases I use PSAR to be in trend & exit if PSAR direction change
You can use any one of above mentioned or your own way to manage risk
Time Frame :- I take ~ 90% of my intraday trades in 15m tf. Where my analysis might come from higher frames like W , D or 1hr chart pattern which will be mentioned.
Target :- I do set target line based on support / resistance slightly above/ below it . Please pay attention to it
PIDILITIND trade ideas


Pidilite is back in actio Previous Weekly chart parallel channel has again a mew entry this week. Lets see if it travels along the same trend.


Pidilite_Educational viewPossible upside potential upto 2060 before 20/01/2021
Provided:
if it breaches, 1752 by or before 28/12/2020
During this period:
Immediate support would be 1625
if it gets into consolidation, then range would be 1574-1630
Strong bottom support: 1480
Only an educational view


Pidilite Industries - Intraday Trade SetupPidilite Industries CMP - 1533.60
Looking bearish in higher time frame. One can go for Intraday Trade setup with the following entry, exit & targets
Sell at or Below - 1530 / Stop Loss - 1541
Target 1 - 1522
Target 2 - 1512
Target 3 - 1503
Disclaimer: This is my view and for educational purpose only.

PIDILITIND LOOK OUT FOR THESE LEVELS!!! ALL THE LEVELS AND PATTERNS ARE MARKED ON CHART, RED ZONES DENOTES SUPPLY ZONES AND GREEN IS FOR DEMAND ZONE .
BUY BETWEEN 1575-1565 FOR TARGETS OF 1600/1620/1640 SL: 1545
The indicator used:
1) Daily Lines plots Daily 20 (BLACK) & 50 EMA (GREY) on lower time frame charts
2) TE-REKAB
- PB : PULLBACK
If you like the analysis, do leave a like and follow for more such content coming up.
The analysis is my POV, hope you got bucks in your pocket to consult a financial advisor before investing :P :)
HAPPY TRADING!


PIDILIND - INTRADAY BUY AND SELL LEVELSBUY ABOVE 1602
STOP LOSS BELOW 1589
TARGETS 1609/1614/1620
SELL BELOW 1581.50
SL 1595
TARGETS 1576/1572/1568


Pidilite Industries - Intraday / Swing Trade SetupPidilite Industries CMP - 1500.30
Looking bullish in weekly time frame. One can go for short term Investment with the following entry, exit & targets
Buy at or above - 1502 - 1505 / Stop Loss 1490
Target 1 - 1508
Target 2 - 1515
Target 3 – 1520 / 1530 / 1540
Note: This is my view and for educational purpose only.


PIDILITINDTargets are mentioned.
The share is in perfect uptrend .
Currently share is in strong uptrend and supported with good volume.
Share comparatively performed better than market.
Perfect time to entry when the it breaks the resistance region.

Pidilite Industries - Intraday / Swing Trade SetupPidilite Industries CMP- 1536
Range breakout and looking bullish . One can go for Intraday / Swing trade Setup with the following entry, exit & targets
Buy Only above 1540.55 - 1542.50 / Stop Loss 1520
Target 1 - 1549
Target 2 - 1555
Target 3 – 1560 / 1565
Short Term 1600 / 1650
Note: This is my view and for educational purpose only


Pidilite (A consolidation gearing up for a breach ?)Pidilite has formed a beautiful triangle since June and looks like it might just be on the verge of a breakout, however a reversal within the zone isn't ruled out either. The stock has good supports in EMA's on the downside (9EMA (Green), 50EMA(Yellow), 200EMA(Red)), however a volatile and a bearish sentimental day can take them all out. On the bullish side any breach of the triangle on the upside will give a good momentum until 1570-1600 levels, a bearish momentum (a breach of the EMA's and the triangle line on the short side) should put further pressure on the stock and the stock might end up testing 1350 levels.
However we need to keep in mind that it is results season now and fundamentals have kinda bigger role to play so expect some weird momentums to kick and negate your trade altogether. Try and avoid over night positions and if you do make sure to hedge them.
Sentiments are turning negative again with the world recording a record number of cases today and Europe seeing a second wave of the virus any major lockdown might kick the fear in and multiple things will kick in together causing the markets to spiral down. And then the invested would ask why is the market going down without much of a reason similar to when the bears/un invested people asked between April to Present why is the market going high without much reason.
Trade with Caution, possibly some Very Scary times ahead.

