PIDILITIND trade ideas
Pidilite - Bearish WolfewavePidilite has wolfe wave bearish but getting support of rsi , if support broken 1443 would be target and if resistance broken then 1523 will be upward target. Most probably will hit 1443 as it formed wolfe wave and very few times it miss its Estimated Price at Arrival (EPA).
PIDILITE INDUSTRIESNSE:PIDILITIND
PIDILITE GAVE A GOOD BREAKOUT TODAY, IT CAN BE BOUGHT WITH SL OF 1420, WHERE IF IT DOES SUSTAINS CAN SHOW 1450 AND FURTHER MIGHT EXTEND TO 1470.
DO TRAIL YOUR SL
**********************************************************************************************************************************************
Hi all,
Its pleasure to have you all here.
I have started putting these charts as a contribution from my side to all people who are new to business, as I had to struggle a lot without any sources at disposal. So please consider this a just small contribution from my side.
Few Honest Disclosures:
1. Any idea shared is my personal view, its not a recommendation, neither any kind of paid propaganda, so please
do your bit of research.
2. Ideas shared does not mean that I trade all or have position in them, this is just a helping hand to all.
3. I expect no comments or like nor any negativity, as I said its just a small helping hand from my side, please plan your risk and trade as per your capacity.
4. To trade in Cash, options or futures is your sole choice and your own risk
5. I am no expert in Tech Indicators, I believe in support resistance and trendline theory, you may use this as a supplement theory for better results.
6. I work for my own living, this is a hobby which I do sincerely to help anyone who might come across my charts.
***********************************************************************************************************************************************
Perfect Buying Opportunity - Supports & LevelsHey Guys,
Can make big money on this.
Very strong Fundamentals, No big competitors, Hugh market share.
Grab a piece to enjoy a good profit (I would say 1 normal quarter will change the game)
Near to the buying zone:
Stock is moving in to the Following pattern,
Volume in recent times were high.
Bollinger Band:
Fib Re:
Thanks,
Let me know if you have any Questions,
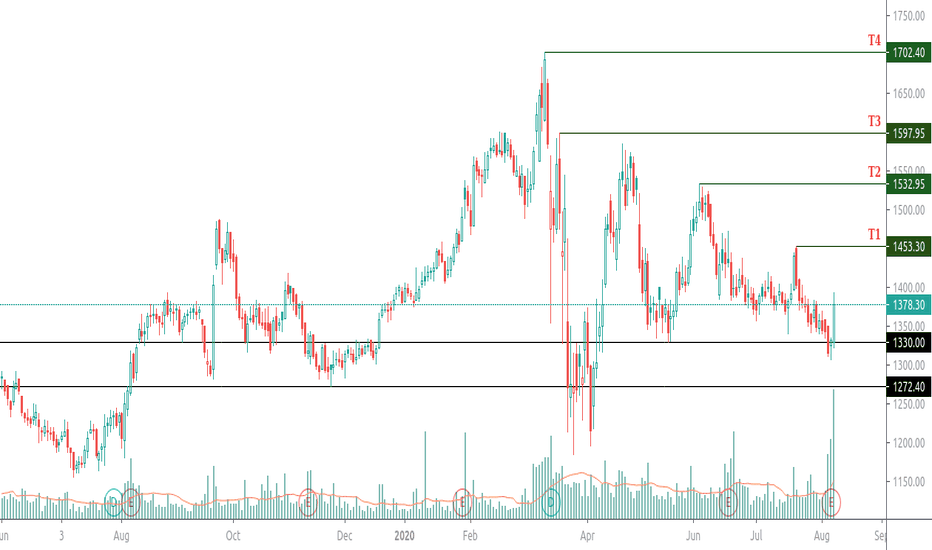
PIDILITE Industries shoing reversal from its support level.NSE:PIDILITIND
PIDILITE on daily chart taken a goods support and showing reversal.
Whats looks interesting here is the price and volume movement at its support level one can check the chart and observe the same.
There is nothing too much complicated here everything is just nice and simple as I expected.
For positional traders its looks bullish on daily chart with SL 1270 Targets are mentioned on chart so do check.
PIDILITE
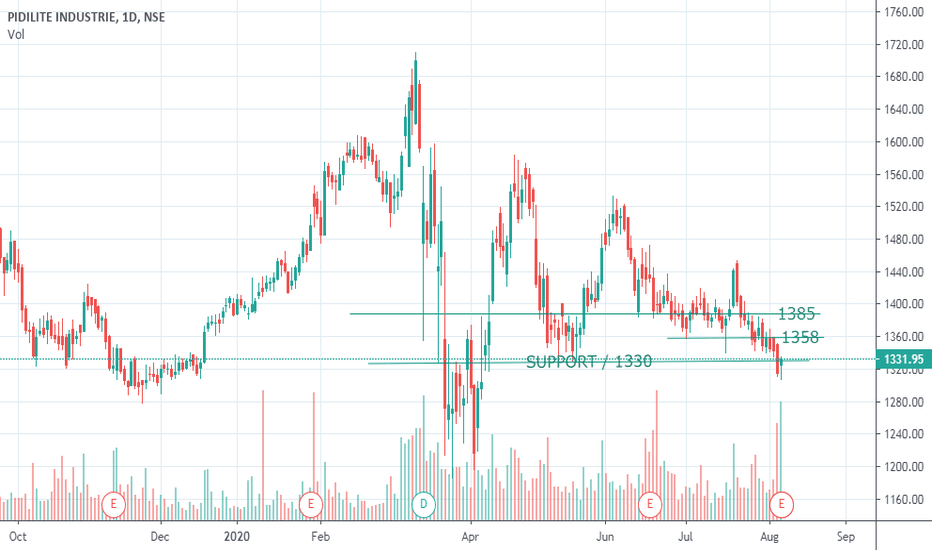
IF YOU CAN CHECK THE ABOVE CHARTS, HAD CLEARLY SAID THAT ONCE 1385 BROKEN IT LL REACH 1330
AND SEE HOW IT REACHED 1330 AND FINALLY CLOSED ABOVE IT
IT MIGHT REVERSE AND MARCH TILL 1346 1358 AND FINALLY 1385 THE LEVELS WHERE WE SHORT
******************************************************************************************************************************************************************
Hi all,
Its pleasure to have you all here.
I have started putting these charts as a contribution from my side to all people who are new to business, as I had to struggle a lot without any sources at disposal. So please consider this a just small contribution from my side.
Few Honest Disclosures:
1. Any idea shared is my personal view, its not a recommendation, neither any kind of paid propaganda, so please
do your bit of research.
2. Ideas shared does not mean that I trade all or have position in them, this is just a helping hand to all.
3. I expect no comments or like nor any negativity, as I said its just a small helping hand from my side, please plan your risk and trade as per your capacity.
4. To trade in Cash, options or futures is your sole choice and your own risk
5. I am no expert in Tech Indicators, I believe in support resistance and trendline theory, you may use this as a supplement theory for better results.
6. I work for my own living, this is a hobby which I do sincerely to help anyone who might come across my charts.
***********************************************************************************************************************************************


