at support zone Overbought and oversold conditions help traders identify potential market reversals.
POLYMED trade ideas
#Poly Medicure LtdPoly Medicure Ltd Breakout Symmetrical Triangle Pattern
Buy - Above 3030
Stop Loss - 2550
Target - 3360 and 3770

Review and plan for 2nd December 2024 Nifty future and banknifty future analysis and intraday plan.
Positional ideas included.
This video is for information/education purpose only. you are 100% responsible for any actions you take by reading/viewing this post.
please consult your financial advisor before taking any action.
----Vinaykumar hiremath, CMT

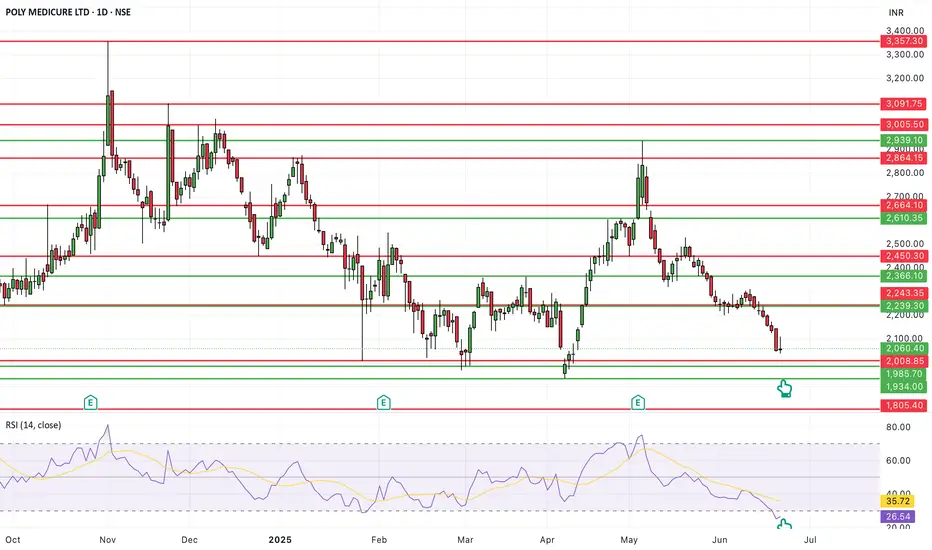
POLY MEDICURE LTD S/RSupport and Resistance Levels:
Support Levels: These are price points (green line/shade) where a downward trend may be halted due to a concentration of buying interest. Imagine them as a safety net where buyers step in, preventing further decline.
Resistance Levels: Conversely, resistance levels (red line/shade) are where upward trends might stall due to increased selling interest. They act like a ceiling where sellers come in to push prices down.
Breakouts:
Bullish Breakout: When the price moves above resistance, it often indicates strong buying interest and the potential for a continued uptrend. Traders may view this as a signal to buy or hold.
Bearish Breakout: When the price falls below support, it can signal strong selling interest and the potential for a continued downtrend. Traders might see this as a cue to sell or avoid buying.
20 EMA (Exponential Moving Average):
Above 20 EMA(50 EMA): If the stock price is above the 20 EMA, it suggests a potential uptrend or bullish momentum.
Below 20 EMA: If the stock price is below the 20 EMA, it indicates a potential downtrend or bearish momentum.
Trendline: A trendline is a straight line drawn on a chart to represent the general direction of a data point set.
Uptrend Line: Drawn by connecting the lows in an upward trend. Indicates that the price is moving higher over time. Acts as a support level, where prices tend to bounce upward.
Downtrend Line: Drawn by connecting the highs in a downward trend. Indicates that the price is moving lower over time. It acts as a resistance level, where prices tend to drop.
RSI: RSI readings greater than the 70 level are overbought territory, and RSI readings lower than the 30 level are considered oversold territory.
Combining RSI with Support and Resistance:
Support Level: This is a price level where a stock tends to find buying interest, preventing it from falling further. If RSI is showing an oversold condition (below 30) and the price is near or at a strong support level, it could be a good buy signal.
Resistance Level: This is a price level where a stock tends to find selling interest, preventing it from rising further. If RSI is showing an overbought condition (above 70) and the price is near or at a strong resistance level, it could be a signal to sell or short the asset.
Disclaimer:
I am not a SEBI registered. The information provided here is for learning purposes only and should not be interpreted as financial advice. Consider the broader market context and consult with a qualified financial advisor before making investment decisions.

Bullish opportunity - Swing tradeAll time high breakout with good volumes. Stock had a good consolidation phase before giving this huge breakout.

PolyMedicure Wave AnalysisAccording to the wave analysis, C OF 4th wave down is in progress. Poly Medicure should take support in the range of 1700-1800 and will create RSI divergence on daily charts. Then it can move the next wave up.

Go long - swing pickShows huge delivery %
Go long if 15m close crosses top line
Bottom line is sl, wait for day's candle to close below
Keep 1:1.5 RR.
swing pick - go long - this stock is picked after market close based on delivery qty data.
- follow this stock for next 5 days , if entry not triggered with in 5 days , ignore pick
- if price crosses today's high , go long
- keep candle low as sl , for tgt keep 1:1.5 Risk Reward

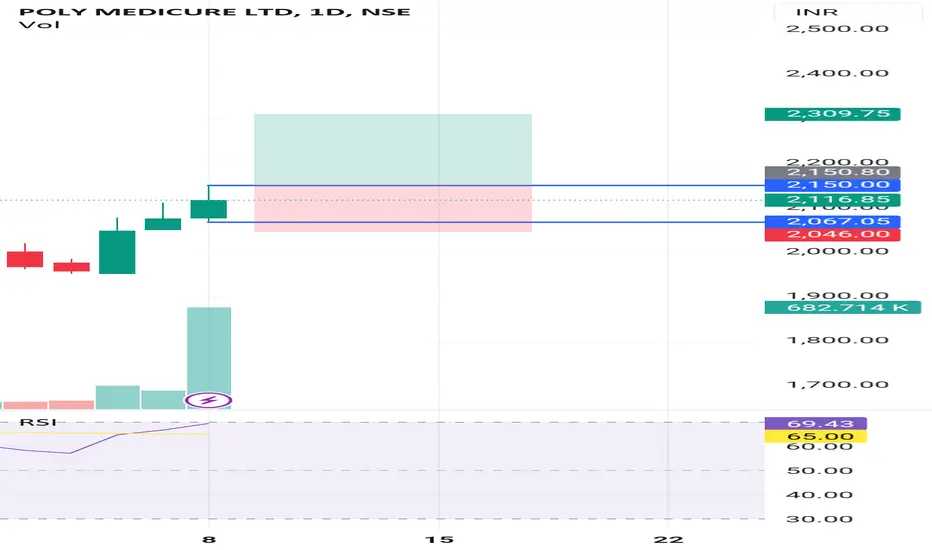
Breakout Opportunity in Poly Medicure Ltd (POLYMED) Stock Analysis
Poly Medicure Ltd (POLYMED) is breaking out above resistance with significant volume spikes.
This suggests strong buying interest and potential for further price movement.
Trading Strategy
Target Placement: The minimum target is mentioned on the chart, but you can aim for higher levels as the price rallies.
Stop Loss: Place your stop loss below the indicated level on the chart.
Consider this for short to mid-term breakout trading. Stay vigilant and trade smart!

rejection at previous swing highs A rejection took place in polycan at swing highs is something to b e cautious about
volumes were 17X more than average volume in a week
resistance at the higher end at swing highs and till that is taken out fresh long side trade comes with a risk

weekend Research: Poly Medicure Ltd CMP 1520.1Poly Medicure Ltd.: Polymed was conceived and established in 1995 by a group of engineers and technocrats dedicated with a vision of providing the highest quality. They are into manufacturing and importing medical devices. They have 8 state of art manufacturing units out of which 5 are situated in India and one each in China, Egypt and Italy.
Negative aspect of the company is that they are off late having some cash flow issues. Price to earning ratio of the company is also 58.7 making it an expensive buy.
Positive aspects of the company are that it is a company with low debt, Zero promoter pledge and improving annual net profits. EPS of the company and it’s book value is also continuously increasing.
Entry in the stock can be taken after closing above 1530. Targets will be 1589 and 1618. Long term target in the company will be 1675. Stop loss should be maintained in the stock at a closing below 1365.
The above information is provided for educational purpose, analysis and paper trading only. Please don't treat this as a buy or sell recommendation for the stock. We do not guarantee any success in highly volatile market or otherwise. Stock market investment is subject to market risks which include global and regional risks. We will not be responsible for any Profit or loss that may occur due to any financial decision taken based on any data provided in this message.

Poly MedicarePoly medicare looking good for swing after successful breakout. Keep an eye on it. View is just for educational purpose.

Poly medicareany volume greaater than 951 k would be good for the next breakout nearest target from here is 1700 . retest have happened after the recent breakout

Poly Medicure-Nice breakoutPoly Medicure-Nice breakout.
Capital to be deployed- 20k
Price -1114-20
Stoploss-1006
Targets-1441/2301
#polymedicure #nifty50 #NiftyBank #investment #StockMarket #StocksToBuy

Resistance Breakout Stock! #POLYMEDResistance Breakout Stock!
Poly Medicure Ltd. #POLYMED
1- 52-Week High
2- Massive Weekly Volume
3- Inverted Head & Shoulders
Note: Technical Analysis is for Educational Purpose. I am not SEBI registered. Consult your financial advisor for any Investment Advice.

Polymed Trying to break the range Polymed Trying to break the range with Bullish Candle, RSI above 70 on 3H

Trendline Breakout in Poly Medicure Limited...Chart is self explanatory.
Disclaimer: This is for demonstration and educational purpose only. This is not buying or selling recommendations. I am not SEBI registered. Please consult your financial advisor before taking any trade.

POLYMED view for 22nd Feb WednesdayPOLYMED view for 22nd Feb Wednesday
947 above it may move upside
Charts for Educational purposes only
Please follow strict risk reward and stop loss if you follow my level
Thanks,
V Trade Point

POLYMED - Buyer dominance Required for Bull RallyBuyer dominance is necessary to break the resistance zone for the bull run.
we could witness a bullish surge following a successful resistance zone breakout.

Poly Med Buy Above 1000this stock has failed in the channel pattern recently,
so if it break this both channel & trendline than buying above 1000 level ,
it is high probability tade.

POLYMED Channel breakout in WeeklyA good breakout from the Channel pattern in Weekly time frame . Draw it in your chart and can take your position with your due diligence

Poly Medicure Ltd Swing High Break*Poly Medicure Ltd*
Time Frame: Daily
Observation:
* Swing High Break
* Mean (EMA) diversion.
Resistance/Target: 1166 1290 1366
Support: 933 845

Poly MedicurePoly Medicure Ltd. engages in the provision and sales of medical devices. Its products are used in infusion therapy, central venous access catheters, blood management, urology, dialysis, diagnostics, and pediatrics. The company was founded by Jugal Kishore Baid on March 30, 1995 and is headquartered in New Delhi, India.
