RAMCO SYSTEMS LTD S/R Support and Resistance Levels:
Support Levels: These are price points (green line/shade) where a downward trend may be halted due to a concentration of buying interest. Imagine them as a safety net where buyers step in, preventing further decline.
Resistance Levels: Conversely, resistance levels (red line/shade) are where upward trends might stall due to increased selling interest. They act like a ceiling where sellers come in to push prices down.
Breakouts:
Bullish Breakout: When the price moves above resistance, it often indicates strong buying interest and the potential for a continued uptrend. Traders may view this as a signal to buy or hold.
Bearish Breakout: When the price falls below support, it can signal strong selling interest and the potential for a continued downtrend. Traders might see this as a cue to sell or avoid buying.
MA Ribbon (EMA 20, EMA 50, EMA 100, EMA 200) :
Above EMA: If the stock price is above the EMA, it suggests a potential uptrend or bullish momentum.
Below EMA: If the stock price is below the EMA, it indicates a potential downtrend or bearish momentum.
Trendline: A trendline is a straight line drawn on a chart to represent the general direction of a data point set.
Uptrend Line: Drawn by connecting the lows in an upward trend. Indicates that the price is moving higher over time. Acts as a support level, where prices tend to bounce upward.
Downtrend Line: Drawn by connecting the highs in a downward trend. Indicates that the price is moving lower over time. It acts as a resistance level, where prices tend to drop.
Disclaimer:
I am not a SEBI registered. The information provided here is for learning purposes only and should not be interpreted as financial advice. Consider the broader market context and consult with a qualified financial advisor before making investment decisions.
RAMCOSYS trade ideas

BREAKOUT RETESTINGScript: NSE:RAMCOSYS
Key highlights: 💡⚡
📈 Script is trading at near its BREAKOUT RETESTING level keep an eye on stock, we may see some good rally.
📈 One can go for Swing and long Trade.
⏱️ C.M.P 📑💰- 455
🟢 Target 🎯🏆 - 510- 660 + + +
SL CB 375
⚠️ Important: Always maintain your Risk & Reward Ratio.
✅Like and follow to never miss a new idea!✅
Disclaimer: I am not SEBI Registered Advisor. My posts are purely for educational purposes.
Eat🍜 Sleep😴 TradingView📈 Repeat 🔁
Happy learning with trading. Cheers!🥂

RAMCOSYS CMP 410Stock trading near 52 week hi zone.Trendline breakout zone.Showing strenth with volume.By the signal of bollinger band breakout.Add to your wachlist and find best risk and reward.

short term 1) short-term target
2) target and stoploss are mentioned in cahrt
3) no recommendation for buy and sell
4) Microcap Company
5) zero fundamental stock

RamcoSYS - Almost there !!!
Hello All,
Apologies, I was banned by moderators, guess my Ban is over now and posting new ideas... The recommendations are purely for educational purpose only, consult you financial advisor before trading.
Targets are mentioned in charts (either red lines or balck lines), keep Stop Loss as per your risk..
If you like my Idea, Don't forget to Boost and comment on my Analysis..
Have a profitable year ahead
Gautam Khanna
Technical Analyst by Passion :-)

Ramco system breakout Ramco system breakout
Buy for swing trading
Target for 375 to 380
Stop loss 268

ITs Trying to Come out of Consolidation.Stock has shown significant move.
Made low 190 currently at 307 near resistance for last one year.
Immediate support is at the 270.
if broken above the 307 , it shall test next resistance range of 365 to 376.
Forming head and shoulders chart pattern with 307 resistance range.

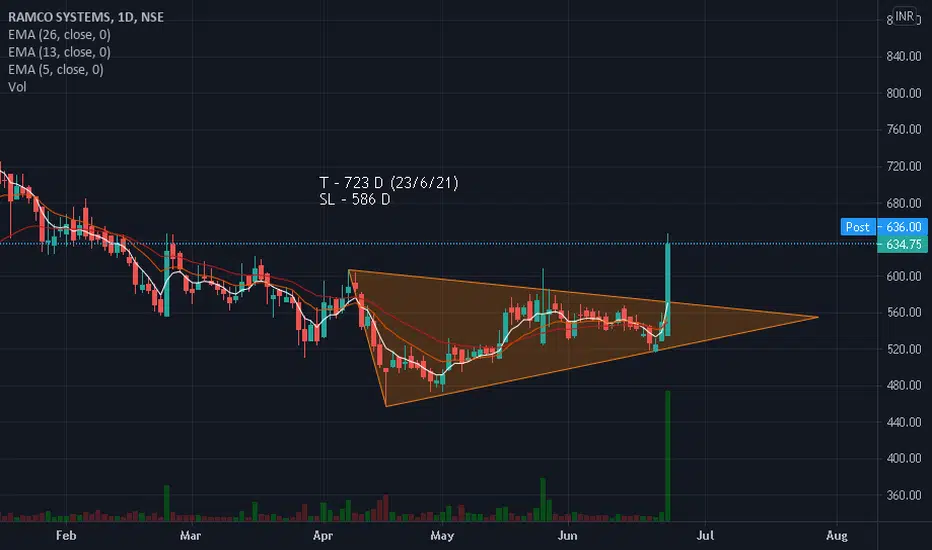
Wedge Pattern BreakoutPlease look into the chart for a detailed understanding.
Consider these for short-term & swing trades with 2% profit.
For BTST trades consider booking
target for 1% - 2%
For long-term trades look out for resistance drawn above closing.
Please consider these ideas for educational purpose

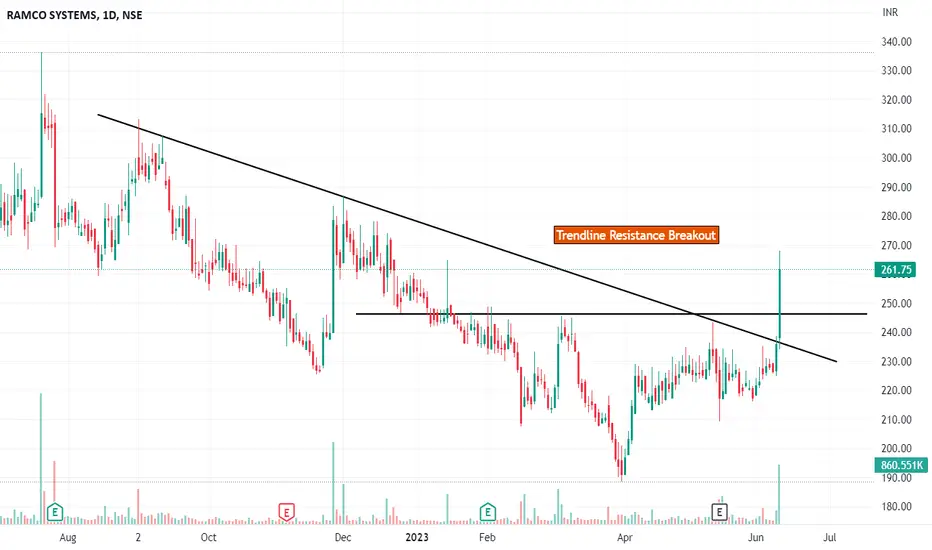
Trendline Resistance BreakoutPlease look into the chart for a detailed understanding.
Consider these for short-term & swing trades with 2% profit.
For BTST trades consider booking
target for 1% - 2%
Please consider these ideas for educational purpose
Comment below if you are looking for any answers

ramco systemRamco Systems Limited, a global aviation software provider, announced that its Aviation M&E MRO Suite V5.9 has successfully gone live at Air Asia Company Limited (AACL), Taiwan's first privately-owned aircraft maintenance company catering to aircraft maintenance of commercial aircraft, helicopters, military, and a designated 'Government-owned contractor operated facility' (GOCO), automating and digitally transforming AACL's business processes.

Bullish BiasBullish Bias.................................................................................................


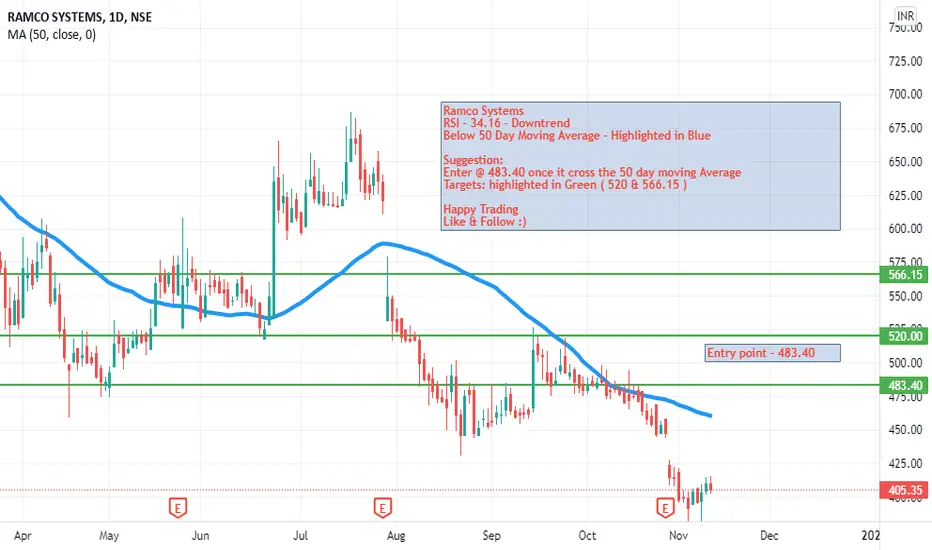
Ramco SystemsRamco Systems
RSI - 34.16 - Downtrend
Below 50 Day Moving Average - Highlighted in Blue
Suggestion:
Enter @ 483.40 once it cross the 50 day moving Average
Targets: highlighted in Green ( 520 & 566.15 )
Happy Trading
Like & Follow :)
May Increase upto 100 INRNear short term support, Above 200 SMA, wait for confirmation before making trade.
Please tell me what do you think about ....


Ramco System -- Buy Opportunity Trend Reversal and Buying Opportunity for Ramco Systems
Follow me for more ideas like this

RAMCO SYSTEMS BEARISH MOVEMENT & MOMENTUM - TARGET 420RAMCO SYSTEMS is below red kumo clouds and moreover approaching support levels around Rs 420. Momentum also indicating a weak trend and moreover ADX indicating bearish trend. If it reaches support level of 420 then it's a good time to pick up since future financials of the company are looking solid and they have a huge growth factor in digital India adoption. Future target: 600


Ramco System CMP 482Stock has given good breakout after few weeks of consolidation. It is looking vert strong on charts for sky rocket like movement. Target: Open Stop loss: 430


