Raymond, 4Hr, Long, ResistanceRaymond is showing a resistance in 4 hour Time Frame. If it closes above 765 then it may go up from here, if it closes above it with Bullish candlestick patterns like Bullish Engulfing, Hammer & Inverted Hammer, Piercing Line, Morning Star, Three White Soldiers, Tweezer Bottoms or Bullish Harami.
Entry: 765
Target: 800
RAYMOND trade ideas

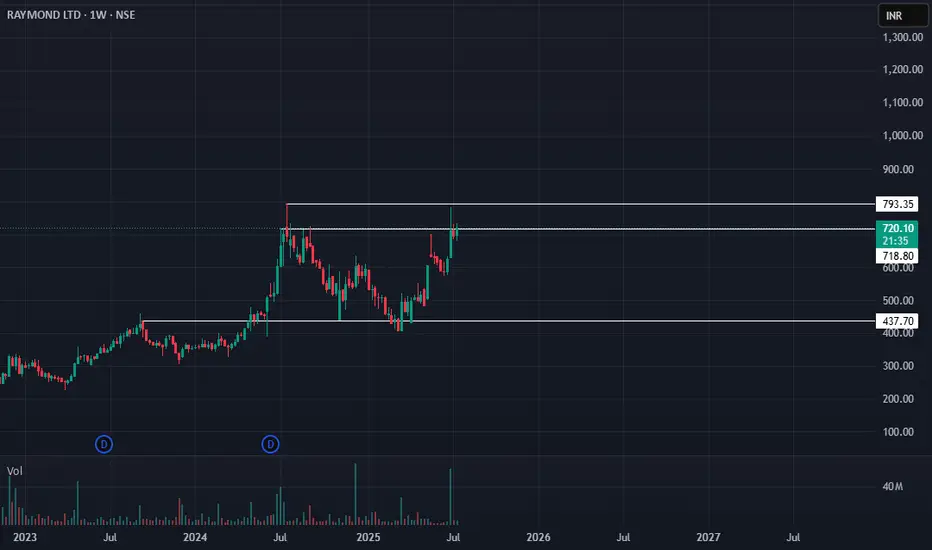
Raymond: Poised for All-Time High Breakout?🚀 Raymond: Poised for All-Time High Breakout? 🚀
💰 CMP: ₹722
🔒 Stop Loss: ₹578
🎯 Targets: ₹780 | ₹828 | ₹880
🔍 Rationale:
Raymond is showing strong signs of an all-time high breakout with its highest weekly close, a successful breakout, small pullback, and resumption of upward momentum. Range breakout continuation can drive prices higher.
🔔 Notification:
Options are risky instruments. Be careful with fund size and position sizing. Trades shared are based purely on technical analysis and personal study.
⚠️ Clarification:
This is an independent analysis based purely on technical and market study. No part of Religare is involved in this view or recommendation.
📝 Important:
I am not responsible for any loss or profit incurred. I am not taking any fees for these views – just sharing my analysis for educational and informational purposes.
📉 Disclaimer:
Not SEBI-registered. Please do your own research or consult a financial advisor before taking any investment decision.
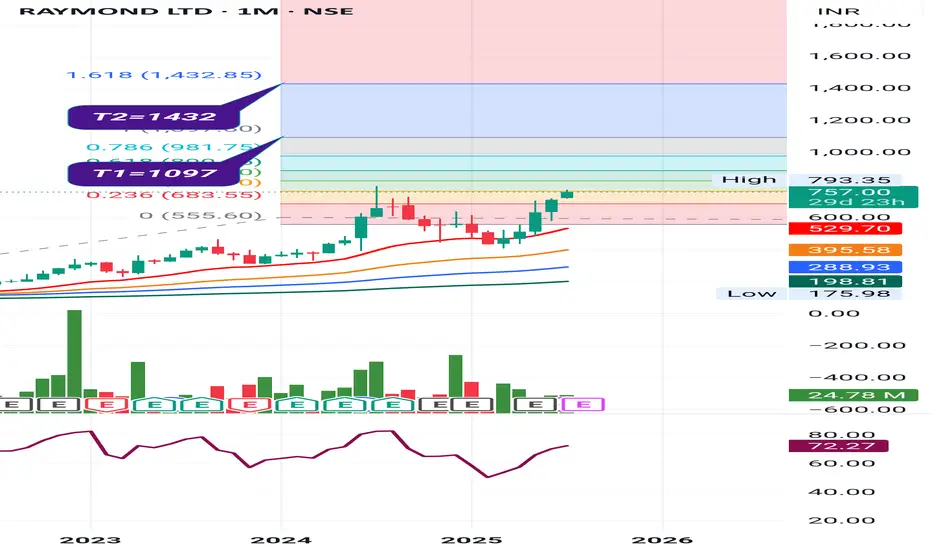
Raymond Ltd Raymond Ltd
P&F on Yearly Basis.
With BO.
EMAs: Widening gaps amongst 20/50/100/200 levels on monthly basis.
Vol. Built-up needs to be watched.
Trail SL with Upside.
Book Profit as per Risk Appetite.
This is an Opinion. Do Your Own Research as well.
Happy Investing.
Raymond: Tall Buildings, Crashing McapMcap 3750
Category Small Cap
Yes its a Small Cap
The main company ( Raymond Lifestyle) with a formidable brand is actually a loss making company with a Mcap of 6000 cr and a quarterly loss of 50 cr.
Badly run company.
SELL Raymond Ltd

Raymond 1 d chart signalling price action Raymond is looking in the uptrend after making a low near 1326. It is reversing from there on daily chart .
Ascending triangle pattern is forming and is about to complete the same .
Volume is Supporting in this uptrend .
RSI momentum is showing intact with higher high with Price in conjunction. Both are in same tandem . Signaling bullish momentum.
If price closed above 1829 on daily chart further bullish Moment can be expected .
If price closed below 1428 on daily chart further bearish Moment can be expected .

Raymond Rockets Past ₹1811! Bullish Targets Await!Raymond on the 4-hour timeframe has initiated a long trade setup, with TP1 already achieved at ₹1811.60. This trade was identified using the Risological Swing Trading Indicator , which confirms the potential for further bullish movement as long as the trend holds steady.
Key Levels:
TP1: ₹1811.60 ✅
TP2: ₹2058.55
TP3: ₹2305.50
TP4: ₹2458.15
Technical Analysis:
The entry price of ₹1659.00 has delivered a strong upward momentum, surpassing the first profit target with ease. The stop-loss is placed at ₹1535.55 to manage risk. The price has clearly broken out from consolidation and has been following the Risological trend line, indicating a strong continuation in the upward trend. Traders can aim for the remaining targets with confidence if the current bullish trajectory persists.

RAYMONDRAYMOND
Good Volume With Trendline Breakout
RSI Above 60
Price Close Above EMA
Buy :- 1837
SL :- 1583
Target :- 1850 / 1960 / 2086 / 2316

RAYMOND LTD S/R Support and Resistance Levels:
Support Levels: These are price points (green line/share) where a downward trend may be halted due to a concentration of buying interest. Imagine them as a safety net where buyers step in, preventing further decline.
Resistance Levels: Conversely, resistance levels (red line/shade) are where upward trends might stall due to increased selling interest. They act like a ceiling where sellers come in to push prices down.
Breakouts:
Bullish Breakout: When the price moves above resistance, it often indicates strong buying interest and the potential for a continued uptrend. Traders may view this as a signal to buy or hold.
Bearish Breakout: When the price falls below support, it can signal strong selling interest and the potential for a continued downtrend. Traders might see this as a cue to sell or avoid buying.
20 EMA (Exponential Moving Average):
Above 20 EMA: If the stock price is above the 20 EMA, it suggests a potential uptrend or bullish momentum.
Below 20 EMA: If the stock price is below the 20 EMA, it indicates a potential downtrend or bearish momentum.
Disclaimer:
I am not a SEBI registered. The information provided here is for learning purposes only and should not be interpreted as financial advice. It's important to remember that while these indicators can be useful, they are not foolproof. Always consider the broader market context and consult with a qualified financial advisor before making any investment decisions.

Raymond - Risky Whisky🎯The stock is in red as the Raymond Boss is getting divorced. Details here -
x.com
🎯 The price is down about 20% since the news came out, the company is still the same.
🎯Price stands at 1500 i.e. the first psy. Support level
🎯The delivery data shows an accumulation
🎯We may see a quick bounce from here
🎯 if the fall continues, 1212 is a significant support a.k.a Risky Whiskey
⚠️Disclaimer: We are not registered advisors. The views expressed here are merely personal opinions. Irrespective of the language used, Nothing mentioned here should be considered as advice or recommendation. Please consult with your financial advisors before making any investment decisions. Like everybody else, we too can be wrong at times

RAYMONDRAYMOND --TRG 3434 first achieved 2nd resistance 3750-65 . 4876 is also achievable as per fibo ext first will have to see how it reacts at 3750-65 level

Camerla Pivot setup TF 15M Intraday product Type - Intraday
Time Frame - 15 Min
1) Target - 52Points ( size of 3rd candle )
2) Entry - 3rd green cnadle close
3) SL - 50% of the 3rd candle

Raymond Ltd- Nice BreakoutRaymond Ltd- Nice Breakout
Capital to be deployed- 20k
Investing Price -2380-2400
Breakout Price -2349
Stoploss -1931
Targets -3505-3942
#raymond #StockMarketindia #StockToWatch #StocksInFocus #stockstowatch #StocksToTrade

#RAYMONDRaymond Realty
The company started phase 1 of the real estate business in Feb 2019.It has planned development of 20 acres of residential development − Phase 1: ~14 acres of development
Total 10 towers with ~2.7 mn sq. ft of saleable area Total units planned for sale: 2,976.
Cumulative bookings of 1,173 units till Dec-20
The company received ~Rs.1610 crs as booking value in Real estate in FY23. In total , Raymond received total booking value of ~ ₹3,900 Cr. within 4 years of launch
Debt Reduction
The company reduced its debt by ~Rs. 400 crs to Rs. ₹689 crs. as of FY23.
PROS
Company has delivered good profit growth of 37.4% CAGR over last 5 years
Debtor days have improved from 62.0 to 33.1 days.
Company's working capital requirements have reduced from 71.5 days to 55.3 days

Raymondinteresting wave formation on Raymond chart which is showing an upward slanting wave 4 which could have been done for the next impulse to start


RAYMONDNSE:RAYMOND
One Can Enter Now ! Or Wait for Retest of the Trendline (BO) Or wait For better R:R ratio
Note :
1.One Can Go long with a Strict SL below the Trendline or Swing Low of Daily Candle.
2. Close, should be good and Clean.
3. R:R ratio should be 1 :2 minimum
4. Plan as per your RISK appetite
Disclaimer : You are responsible for your Profits and loss, Shared for Educational purpose

RAYMOND: Support levelsNSE:RAYMOND has again come near its trendline support. Raymond has been slipping due to internal problems of Md.

$raymondat the 21 ema so we should see a bounce if not then 200 ema below is likely next stop
not in this just heard about the familia saga and thought why not have a look
short below white line
long as long as that holds

KRBK - Stock AnalysisKRBL Ltd. is exhibiting strong bullish momentum across various technical and fundamental indicators, making it an appealing prospect for investors. In the short term, the one-day analysis reveals a "Strong Bullish" sentiment, with the latest tick indicating a robust price rise supported by substantial trading volume. The Parabolic SAR (PSAR) is also "Bullish" with a bullish crossover, further bolstering the bullish outlook.
The MACD indicator is "Strong Bullish," with the Macd/Signal line displaying a bullish crossover, suggesting that the stock is trending favorably. The CCI (Commodity Channel Index) is showing "Strong Bullish" signals as it is rising from the oversold level of 100.0, indicating a very bullish sentiment. Similarly, the RSI (Relative Strength Index) is also "Strong Bullish," rising from the oversold level of 70.0, which is a very bullish signal.
The ADX (Average Directional Index) is "Bullish" and indicates a bullish reversal, further reinforcing the positive sentiment. The HighLowMABand is "Strong Bullish" with a positive breakout pattern. The daily candlestick pattern is also "Strong Bullish," providing additional technical support for the stock.
In terms of short-term support, KRBL Ltd. has identified key support levels, with bottom points at 357.0 on November 1, 2023, and 358.6 on October 25, 2023, which can be essential reference points for traders and investors.
From a fundamental perspective, the company appears undervalued with a Price to Intrinsic Value of 0.773, a Price to Earnings Ratio of 11.50, and an EV to EBITDA ratio of 7.86. These metrics collectively suggest that the company's stock may be trading at a discount to its intrinsic value.
KRBL Ltd. has seen a significant increase in its Book Value over the last three years, indicating a robust financial position. The company also offers an Earning Yield of 8.70% and demonstrates excellent quarter-over-quarter (QoQ) earnings per share (EPS) growth. While the Piotroski F Score is at a stable value of 5.0, the annual net profit has been on an upward trend over the last three years.
Additionally, the company maintains a good Return On Capital Employed of 14.32% and a solid Return on Equity of 16.50%. A healthy net margin of 13.18% adds to its financial strength, although it offers a relatively low dividend yield of 0.270%, indicating a preference for reinvesting profits for growth.
Notably, KRBL Ltd. has achieved annual sales growth for three consecutive years, and there has been a steady increase in total assets over the last three years, reflecting the company's consistent expansion and overall financial stability. These combined technical and fundamental indicators position KRBL Ltd. as an attractive investment opportunity with strong growth potential.
Go Long above 381.95
Stop Loss 341

RAYMOND - AnalysisRaymond Ltd. is currently showing strong signs of bullish momentum in the market, backed by various technical and fundamental indicators. The one-day analysis reveals a strong bullish sentiment with a significant price rise supported by robust trading volume. The Parabolic SAR (PSAR) is bullish, indicating a crossover that supports the upward trend. HighLowBand and HighLowMABand indicators are both strongly bullish, signaling a positive breakout. The daily candlestick pattern is also displaying a strong bullish signal.
Raymond Ltd. has encountered notable resistance levels in the short term, with top points at 1813.4 on November 2, 2023, 1805.05 on October 17, 2023, 1810.65 on October 10, 2023, and 1812.2 on September 28, 2023. These resistance levels provide additional evidence of the stock's potential for an upward breakout and may serve as important reference points for traders and investors.
In terms of short-term resistance, Raymond Ltd. has faced several key points, with the latest being at 1813.4 on November 2, 2023. This suggests that the stock is poised for further potential upside. Furthermore, the company's Price to Earnings Ratio is at an attractive 7.47, and the EV to EBITDA ratio stands at 6.07, indicating that the company may be undervalued. This undervaluation is reinforced by the Price to Intrinsic Value ratio of 0.768 and an impressive Piotroski F Score of 8.0, highlighting the company's excellent financial health.
Raymond Ltd. has delivered a remarkable Earning Yield of 13.38% and has demonstrated excellent quarter-over-quarter (QoQ) earnings per share (EPS) growth. Over the past year, the company has achieved a strong Return On Equity of 56.76%. The annual net profit has been on a consistent upward trajectory over the last three years, and the net profit has increased for the last five consecutive quarters. Earnings Before Interest, Taxes, Depreciation, and Amortization (EBITDA) has shown steady growth over the past three years, while EPS has exhibited consistent growth over the last four quarters.
The company maintains a good Return On Capital Employed of 10.38% and a healthy net margin of 18.33%. However, it's important to note that Raymond Ltd. offers a relatively low dividend yield of 0.170%, indicating a focus on reinvesting profits for growth. Additionally, the company's debt-to-equity ratio has decreased and is currently at its lowest point in the last five years, suggesting improved financial stability.
Notably, the year-over-year net margin has experienced a significant jump of 46.55%, reflecting the company's improving profitability. Furthermore, there has been a consistent increase in total assets over the past three years, indicating a steady expansion of the company's overall financial strength. All these indicators collectively suggest that Raymond Ltd. is on a strong growth trajectory, making it an attractive prospect for investors seeking undervalued stocks with solid fundamentals and technical strength.
Go Long above 1819.95
Stop Loss 1641

RAYMOND LTD - Gearing up to scale New HeightsThe stock has been a multi bagger giving almost 5x returns in the last two years. Recently the up move had been halted with a “BC” Bar. Then the stock after retreating started to move up attempting to take out the “BC” bar. It failed and is now attempting again. We see a clear a Volatility Contraction Pattern. The stock is still in a supply area. Once we have a good close above 1786 the stock is likely to scale new highs.

240 MINS TIME FRAME - RAYMOND STOCKThe Structure looks good to us, waiting for this instrument to correct and then give us these opportunities as shown on this instrument (Price Chart).
Note: Its my view only and its for educational purpose only. Only who has got knowledge about this strategy, will understand what to be done on this setup. its purely based on my technical analysis only (strategies). we don't focus on the short term moves, we look for only for Bullish or Bearish Impulsive moves on the setups after a good price action is formed as per the strategy. we never get into corrective moves. because it will test our patience and also it will be a bullish or a bearish trap. and try trade the big moves.
we do not get into bullish or bearish traps. We anticipate and get into only big bullish or bearish moves (Impulsive Moves). Just ride the Bullish or Bearish Impulsive Move. Learn & Know the Complete Market Cycle.
Buy Low and Sell High Concept. Buy at Cheaper Price and Sell at Expensive Price.
Keep it simple, keep it Unique.
please keep your comments useful & respectful.
Thanks for your support....
Tradelikemee Academy

RaymondRaymond is in a channel line trend since April 2021. For swing trade , we can select the lower trend line as an entry point. Close below this line is an exit. Target is the upper trend line w.r.t to time.
