RBL bank showing positive price action on weekly chatDown trend in RBL bank terminated by forming a CUP & Handle Pattern(also 200SMA Breakout was there) ,Breakout of this pattern was in june 23 & Target of this pattern was arround 290 level ,stock hit the same in Jan 24 ,After hitting the target stock now try to take support on 200SMA (which is arround 190).From here one can accumulate the stock (Stoploss 185) for a target price of 290 .
RBLBANK trade ideas

2 scenarios for RBLRBL is at a key resistance area. I see only 2 possible outcomes, either a cup and handle formation, or downright rejection to the bottom of the channel. Pick your poison. If it consolidates and gives a breakout, 270-300 can be target. Since I'm a long only guy on Indian sticks, that's my preference but as always, market doesn't care what I want. I have already bought from 180 levels, will add more if it goes lower.

RBLBANK | Buy @LTP | SL below 170 | 1st Target 209Disclaimer:
This is not financial advice. Please do your own research or consult with a financial advisor before making any investment decisions. Investments in stocks can be risky and may result in loss of capital.

RBLBANK | Buy if close above 182| SL below 170 | 1st Target 214 Disclaimer:
This is not financial advice. Please do your own research or consult with a financial advisor before making any investment decisions. Investments in stocks can be risky and may result in loss of capital.

RBLBANK KEY LEVEL FOR 17/02/2025//description
// All credit goes to Tony for the concept of this indicator. His Trading View link: www.tradingview.com
// Note: The calculation method in this indicator differs from Tony's, but the concept is derived from his work.
I want to make it clear that I am not a seller, and this method was not taught to me by anyone. The original creator only gave me one clue:
👉 "If you get one level, you get all levels."
Everything else—the way I nail it the method and applied it—is my own work. I respect the original idea, but my approach is independent.
Explanation:
This trading system helps you avoid blind trades by providing confirmation for better entries and exits.
Entry/Exit Points:
- Entry/Exit Lines: Use the BLACK line for long trades and the RED line for short trades, based on confirmation from your trading plan.
- Stop Loss: For long trades, set the stop loss at the RED line below. For short trades, set it at the BLACK line above.
- Take Profit: For long trades, target the next RED line above. For short trades, target the next BLACK line below.
Timeframe:
Use a 5 mins timeframe for trading.
Risk Disclaimer:
This setup is for educational purposes. I'm not responsible for your gains or losses. Check the chart for more details.

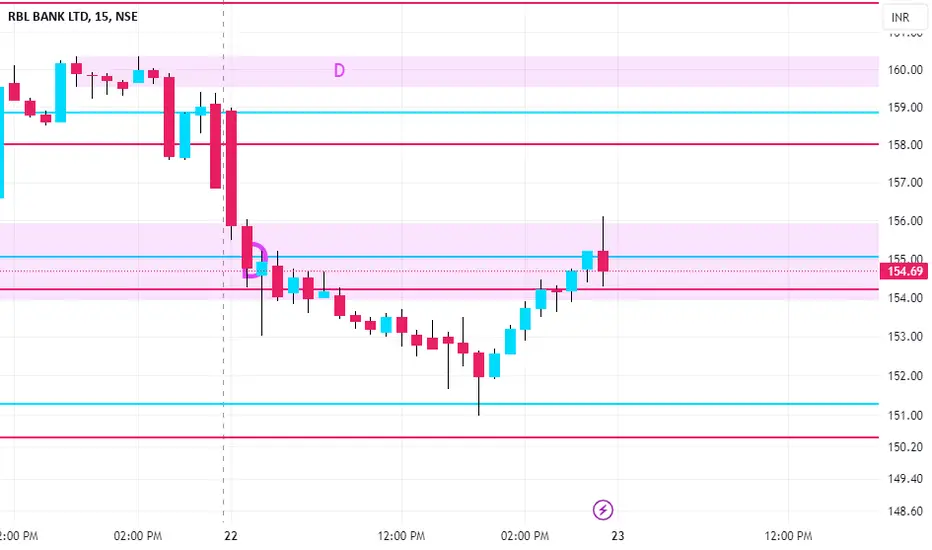
Stocks I'm looking to short tomorrow in #StockMarketIndiaStocks I'm looking to short tomorrow in #StockMarketIndia:
1. RBL BANK NSE:RBLBANK
Entry Level: ~164
Target Level: ~154
Potential Drop: -5.95% (~9.85 points)
✅Volume Consideration: Moderate liquidity (~301.92K)
✅Trade Plan:The price has broken support around 164, signaling a short opportunity.
✅Maintain a stop-loss above the entry point (~166-167) to avoid false breakouts.
✅Look for confirmation with increasing selling volume.
2. INDIAMART INTERMESH NSE:INDIAMART
Entry Level: ~2,150
Target Level: ~2,040
Potential Drop: -4.74% (~101.90 points)
✅Volume Consideration: Low (~11.17K), so be cautious of liquidity.
✅Trade Plan:The price is rejecting resistance around 2,150, a strong short opportunity.
✅A tight stop-loss around 2,175 to manage risk.
✅Consider scaling out partial positions near 2,080 to secure profits.
3. ULTRATECH CEMENT NSE:ULTRACEMCO
Entry Level: ~11,309
Target Level: ~10,944
Potential Drop: -3.23% (~365.60 points)
✅Volume Consideration: High (~25.88K), meaning smooth execution.
✅Trade Plan:The stock has rejected an intraday resistance and is forming a downward move.
✅A stop-loss above 11,400 should prevent large losses.
✅Watch for large institutional selling volume confirming breakdowns.
🎯General Risk Management:
✅ Position Sizing: Do not risk more than 2% of total capital on any trade.
✅ Stop-Loss Placement: Maintain strict discipline on SL levels.
✅ Exit Strategy: If market sentiment shifts, consider exiting early.
Just for educational purpose. 📚
Not a Buy/Sell Reccomendations❌❌❌

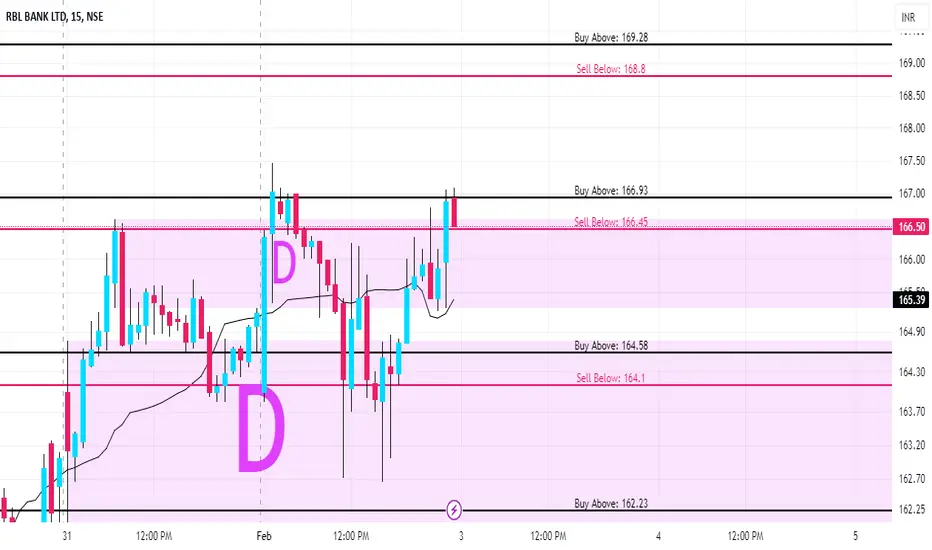
RBLBANK KEY LEVELS FOR 03/02/2025**Explanation:**
This trading system helps you avoid blind trades by providing confirmation for better entries and exits.
**Entry/Exit Points:**
- **Entry/Exit Lines:** Use the BLACK line for long trades and the RED line for short trades, based on confirmation from your trading plan.
- **Stop Loss:** For long trades, set the stop loss at the RED line below. For short trades, set it at the BLACK line above.
- **Take Profit:** For long trades, target the next RED line above. For short trades, target the next BLACK line below.
**Timeframe:**
Use a 5 mins timeframe for trading.
**Risk Disclaimer:**
This setup is for educational purposes. I'm not responsible for your gains or losses. Check the chart for more details.

RBLBANK KEY LEVELS FOR 27/01/2025**Explanation:**
This trading system helps you avoid blind trades by providing confirmation for better entries and exits.
**Entry/Exit Points:**
- **Entry/Exit Lines:** Use the BLACK line for long trades and the RED line for short trades, based on confirmation from your trading plan.
- **Stop Loss:** For long trades, set the stop loss at the RED line below. For short trades, set it at the BLACK line above.
- **Take Profit:** For long trades, target the next RED line above. For short trades, target the next BLACK line below.
**Timeframe:**
Use a 5 timeframe for trading.
**Risk Disclaimer:**
This setup is for educational purposes. I'm not responsible for your gains or losses. Check the chart for more details.

RBLBANK KEY LEVELS FOR 23/01/2025**Explanation:**
This trading system helps you avoid blind trades by providing confirmation for better entries and exits.
**Entry/Exit Points:**
- **Entry/Exit Lines:** Use the BLACK line for long trades and the RED line for short trades, based on confirmation from your trading plan.
- **Stop Loss:** For long trades, set the stop loss at the RED line below. For short trades, set it at the BLACK line above.
- **Take Profit:** For long trades, target the next RED line above. For short trades, target the next BLACK line below.
**Timeframe:**
Use a 5 timeframe for trading.
**Risk Disclaimer:**
This setup is for educational purposes. I'm not responsible for your gains or losses. Check the chart for more details.
RBL Turnaround??RBL was a Rs 700 stock, before falling from grace....we are clearly in a support area and i envision 2 paths for this stock, note the tight downward channel on weekly....there is buying interest with huge upside potential...Although stocks have a habit of making multiple trips to support area before an actual reversal, don't expect anything major for a while, but once the momentum starts, it will be difficult to enter....I'm buying with every dip to bring my average cost down which is 200 at this point, and i have multiple sell orders stacked till 700.....Use your own risk management.....

Review and plan for 20th January 2025 Nifty future and banknifty future analysis and intraday plan.
Results analysis.
This video is for information/education purpose only. you are 100% responsible for any actions you take by reading/viewing this post.
please consult your financial advisor before taking any action.
----Vinaykumar hiremath, CMT

$RBLBANK showing 5R opportunity in long termNSE:RBLBANK showing 5R opportunity in long term. Change of character observed last year . traversing back to OB will be a good trade if it works out

Lapu Star Risk Idea( {cash} ( latest close <= latest lower bollinger band ( 20,2 ) and latest rsi ( 14 ) <= 40 ) )

RBLBANK KEY LEVELS 12/12/2024//@description
// All credit goes to Tony for the concept of this indicator. His Trading View link: www.tradingview.com
// Note: The calculation method in this indicator differs from Tony's, but the concept is derived from his work.
**Explanation:**
This trading system helps you avoid blind trades by providing confirmation for better entries and exits. It considers volume, past prices, price range and indiavix.
**Entry/Exit Points:**
- **Entry/Exit Lines:** Use the BLACK line for long trades and the RED line for short trades, based on confirmation from your trading plan.
- **Stop Loss:** For long trades, set the stop loss at the RED line below. For short trades, set it at the BLACK line above.
- **Take Profit:** For long trades, target the next RED line above. For short trades, target the next BLACK line below.
**Timeframe:**
Use a 5 timeframe for trading.
**Risk Disclaimer:**
This setup is for educational purposes. I'm not responsible for your gains or losses. Check the chart for more details.

Plan for 21st October 2024 Nifty future and banknifty future analysis and intraday plan in kannada.
Resuls analysis - included
This video is for information/education purpose only. you are 100% responsible for any actions you take by reading/viewing this post.
please consult your financial advisor before taking any action.
----Vinaykumar hiremath, CMT

Review and plan for 22nd August 2024Nifty future and banknifty future analysis and intraday plan in kannada.
Swing ideas.
This video is for information/education purpose only. you are 100% responsible for any actions you take by reading/viewing this post.
please consult your financial advisor before taking any action.
----Vinaykumar hiremath, CMT

RBL bank - 0.75 PBV . Cheap. BuyStock trades at cheap valuations of c0.75 PBV
Good risk reward in going long hereon
Trendline support nearby

Understanding Complex Structures: Elliott Wave Theory in ActionTechnical Analysis on Exampled chart of RBL Bank Ltd. using Elliott Wave Theory
Understanding Complex Structures: Elliott Wave Theory in Action
This analysis uses Elliott Wave Theory & Structures, which involve multiple possibilities. The analysis presented focuses on one potential scenario. The provided information is for educational purposes only, not trading advice. There is a risk of being completely wrong, and users are warned not to trade or invest solely based on this study. The content is not advisory and does not guarantee profits. We are not responsible for any kind of profits and losses; individuals should consult a financial advisor before making any trading or investment decisions.
Elliott Wave Principles
Elliott Wave Theory, developed by Ralph Nelson Elliott, is a widely used method of technical analysis. It helps traders analyze financial market cycles and forecast market trends by identifying patterns of investor psychology, reflected in price movements. According to Elliott, market prices unfold in specific patterns, termed as "waves". These waves are categorized into:
Impulse Waves: Move in the direction of the overall trend and consist of five sub-waves.
Corrective Waves: Move against the trend and consist of three sub-waves.
Impulse waves are labeled as 1, 2, 3, 4, and 5, and corrective waves are labeled as A, B, and C. Complex corrections are labeled as W, X, Y, and sometimes Z.
Chart Analysis Exampled of RBL Bank Ltd.
Here's a breakdown of the wave counts as illustrated in the chart:
Impulse Wave 1 - 5 as a bigger degree wave (3)
- Starting from the bottom left, the stock initiates an upward movement labeled as waves (i), (ii), (iii), (iv), and (v), culminating in a larger degree Wave (3). This indicates a bullish impulse wave consisting of five sub-waves.
Corrective Wave W-X-Y Correction as a bigger degree Wave (4)
- The chart shows a complex correction starting from top of Wave (3) with set of double correction as wave W-X-Y
Current Market Scenario
- Currently, the stock appears to be completing another corrective wave (Y), marked with sub-waves (a), (b), and potentially completing (c). of wave ((y)) of larger degree wave Y to finish one more larger degree wave (4). Can show some Dips to complete wave (4) along with Bullish Divergences.
Future Projection
Based on the Elliott Wave count, the stock seems to be in the final stages of completing Wave (c) of ((y)) of Y of (4). After this correction, it is anticipated that a new impulsive wave cycle might begin, potentially forming Wave (5) of a larger degree. The projected target for this next upward wave, post-correction, could reach above the previous high near the 300 level or more.
By understanding these principles and analyzing the provided chart, traders can gain insights into potential market movements and make more informed trading decisions.
I am not Sebi registered analyst.
My studies are for educational purpose only.
Please Consult your financial advisor before trading or investing.
I am not responsible for any kinds of your profits and your losses.
Most investors treat trading as a hobby because they have a full-time job doing something else.
However, If you treat trading like a business, it will pay you like a business.
If you treat like a hobby, hobbies don't pay, they cost you...!
Hope this post is helpful to community
Thanks
RK💕
Disclaimer and Risk Warning.
The analysis and discussion provided on in.tradingview.com is intended for educational purposes only and should not be relied upon for trading decisions. RK_Charts is not an investment adviser and the information provided here should not be taken as professional investment advice. Before buying or selling any investments, securities, or precious metals, it is recommended that you conduct your own due diligence. RK_Charts does not share in your profits and will not take responsibility for any losses you may incur. So Please Consult your financial advisor before trading or investing.

buy at zone - swing onlyENTRY
- lines marked below is potential reversal zone ( PRZ)
- entry is strictly inside the zone
- look for buying confirmation in smaller time frame ( 15 minutes preferred )
EXIT
1. target
- mark fib retracement from C to latest swing low
- TGT 1 - 0.236 fib level
- TGT 2 - 0.382 fib level
- TGT 3 - 0.5 fib level ( preferred target )
2. SL
- candle close below (PRZ)
- if u didn't get confirmation inside the zone , ignore this pick
- if candle close is below zone , this pattern becomes invalid . IGNORE THIS PICK
- RE-ENTRY can be done , if u again get buying confirmation inside the zone

RBL Bank Range Bound | key levels RBL Bank Range Bound | key levels
Rbl is Range bound between 268 ~ 228
Bullish Blue Providing support at sp1 @ 242/-
if stay above 270- tgts are 341/441
if stay below 228 - tgts - 180/130
180 is important support level1 -

RBLBANKIt is taking a good support right now. Do your own analysis before entering any trade. Pls boost the idea if it helps you. Thank you

buy at zone ~ intraday / positional- expecting small reversal from this zone
- good for intraday trade
ENTRY
- entry can be taken in two ways
1. place buy order at limit order , marked 0.58 level
2. look for confirmation in smaller time frame inside the zone.
STOP LOSS
- if candle close is below 0.618 level.
TARGET
- mark fib retracement from C to latest swing low
- TGT1 - 0.236 (mostly hits in intraday)
- TGT2 - 0.382
- TGT3 - 0.5
