RCFSeeking a breakout spanning multiple years, I'm fully committed to this opportunity. Anticipate potential movements commencing today, and the probable movement dates are also mentioned in the chart
First installment now and the second immediately after it breaks out of the trendline
SL below 130
RCF trade ideas

Rashtriya Chemicals & Fertilizers Ltd
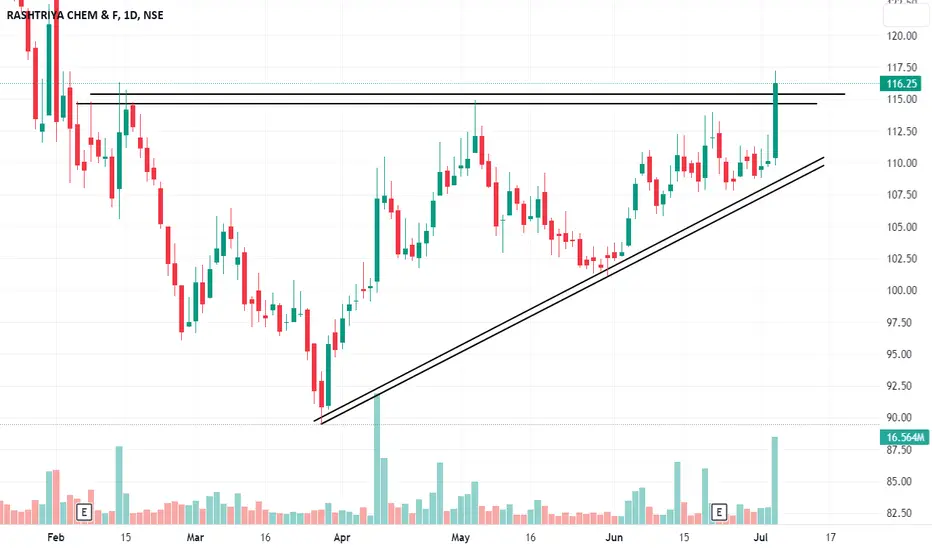
Breakout after long consolidation - Stop Loss @108 - Target open to sky
FUNDAMENTALS
Market Cap
₹ 7,572 Cr.
Current Price
₹ 137
52 W High / Low
₹ 146 / 89.5
Stock P/E
17.7
Book Value
₹ 85.3
Dividend Yield
3.87 %
ROCE
21.2 %
ROE
21.2 %
Face Value
₹ 10.0
Promoter holding
75.0 %
EPS last year
₹ 17.5
EPS latest quarter
₹ 0.92
Debt
₹ 2,298 Cr.
Pledged percentage
0.00 %
Net CF
₹ -1,088 Cr.
Price to Cash Flow
9.62
Free Cash Flow
₹ 402 Cr.
Debt to equity
0.49
OPM last year
6.91 %
OPM 5Year
6.96 %
Reserves
₹ 4,155 Cr.
Price to book value
1.60
Int Coverage
4.03
PEG Ratio
0.28
Price to Sales
0.40
Sales growth 3Years
30.3 %
Profit Var 3Yrs
48.6 %

RCFPSU Fertilizer sector on radar ⚡
Buy at 131 level huge volume seen in fertilizer sector
Target 146 +

Rashtriya Chemicals and FertilizersKeep an eye on NSE:RCF
Stock approaching buy zone for correction.

RCF WITH LOW RISK ENTRY WITH MAX REWARD Breakout trading implementation:
1. **Identifying New Trends:** Breakout trading helps traders identify the beginning of new trends by focusing on price levels where an asset breaks out of its historical trading range.
2. **Volatility Indicator:** Breakouts often occur when there's increased volatility in the market. Monitoring breakouts can provide insights into shifts in market sentiment and potential price movements.
3. **Entry Points:** Breakout points serve as potential entry points for traders looking to ride the momentum of a newly established trend. Buying on a breakout can capture the early stages of a price movement.
4. **Confirmation of Strength:** Successful breakouts indicate the strength of a trend. If an asset breaks out with high volume and follows through with sustained price movement, it suggests a strong trend in that direction.
5. **Avoiding False Signals:** Breakout strategies often include using indicators or confirmation signals to avoid false breakouts. This can enhance the accuracy of trade decisions.
6. **Defined Risk and Reward:** Breakout trading allows for setting clear stop-loss levels below the breakout point, which helps manage risk. Traders can also calculate potential profits based on the distance between the breakout point and a projected target.
7. **Adaptable to Various Markets:** Breakout trading can be applied to various markets, including stocks, forex, commodities, and cryptocurrencies. The concept remains consistent across different assets.
8. **Flexibility:** Traders can adapt breakout strategies to their preferred timeframes, whether they are day traders, swing traders, or long-term investors.
9. **Liquidity Opportunities:** Breakout points are often associated with increased trading volume, which can provide better liquidity for executing trades.
10. **Risk vs. Reward Assessment:** Traders can evaluate the potential risk of a trade (stop-loss) against the potential reward (target price), aiding in decision-making and portfolio management.
11. **Psychological Advantage:** Successful breakout trades can boost a trader's confidence and discipline, reinforcing the effectiveness of their strategy.
12. **Market Events:** Breakouts can occur around significant market events such as earnings reports, economic data releases, or geopolitical developments, offering traders opportunities to capitalize on sudden price movements.
Remember, while breakout trading offers potential advantages, it also carries risks. False breakouts and market reversals can lead to losses. Successful implementation requires a solid understanding of technical analysis, risk management, and the ability to adapt to changing market conditions.

RCF start to ready to break 135 level SL 118 DCB RCF trying to give catch up move above 135 once cross and daily clab 135 can go 140-145 cross 145 review more. CMP 126.30 SL 118 DCB FOR 140-145. For more details go through chart.

Rcf previous swing breakout Rcf previous swing breakout
Buy for swing trading
Target for 150 to 160
Stop loss 118
For Everyday Updates follow me.

RCFRCF has successfully achieved a significant breakout of the crucial Gann box levels, convincingly surpassing the downward trendline on a daily basis with considerable trading volumes. The suggested stop-loss (SL) is set at 110, while the targets have been carefully identified using Gann box analysis.

Triangle Pattern BreakoutPlease look into the chart for a detailed understanding.
Consider these for short-term & swing trades with 2% profit.
For BTST trades consider booking
target for 1% - 2%
For long-term trades look out for resistance drawn above closing.
Please consider these ideas for educational purpose
RCFRcf after many weeks consolidation gave breakout with volume and looking good now
Expecting ath break from here


Best possible Swing trade!!Hello fellow traders,
In this post i am sharing a possible swing trade setup. The stock is RCF(Rshtriya Chemical fertilizers).
TECHNICAL ANALYSIS: As you can see the stock is bullish from 2020 by forming higher lows and higher highs and also takes support at the trend line from 2020. Now the stock has retraced back after forming a higher high and is now on the move to make a new higher high. We can see that it is now forming a cup and handle formation and is about to break out of it. It is also being supported by the 21,50 and 200 daily EMA's.
FUNDAMENTAL ANALYSIS: The company is a fertilizer company. Now is the time of monsoon in India, the time when most of the agricultural practices start and meets the need of a huge population of 1.42 billion people of the country. And more than 50% of the population depends on agriculture for their livelihood. With monsoon starting,the demand for the fertilizer will increase as fertilizer is an important part in the agricultural industry. This may attract FII's as well to make use of the opportunity pushing the stock price up.
RISKS: Monsoon is really important for Indian agriculture. But if the El Nino effect in there in the Pacific it will seriously affect the rainfall the country will get, which will force farmers to stop their cultivation. This could affect the fertilizer demand. As of now the monsoon has reached some south west States of India but the cumulative rainfall till June 20 is said to 33% less than the normal. And the monsoon only reached the country only after fews days from it's normal and estimated time , all thanks to the Biporjoy cyclone. But the IMD says that India will receive 94% of the rain that it gets normally even though there are some barriers in front of it.
You may take the trade once the price breaks above the cup and handle formation (above the marked daily resistance) and keep SL below the resistance (now support) which the price broke. And Target the higher high or the previous high.
DISCLAIMER: THIS IS SOLELY MY VIEW OF THE STOCK AND NOT A FINANCIAL ADVICE. I WILL NOT BE RESPONSIBLE FOR THE TRADES YOU TAKE. DO YOUR RESEARCH,BE WISE AND MANAGE YOUR RISKS.

RCF - Rashtriya Chemical & FertilizersBreakout in Daily Time frame
Scrip Name - RCF
Chart Pattern - Trend line Breakout
Trend - Upward
Volume - High Volume during Breakout
RSI - Above 60
Analysis - RCF has given breakout in daily timeframe in upward direction. Breakout happened with high volume on 5th July 2023. RSI also above 60. RCF was consolidating in daily time frame touching 200 EMA which makes it more stronger breakout. So if we consider factors - Volume, RSI, 200 MA we can give 3 Star to this stock.

RCF buy modebought today little quantity @110 will update as trade goes cannot enter in big quantity as stoploss is not near it is a momentum buying will add on both sides upside and down side will update fresh positions

RCF - Bullish Momentum with volumesNSE: RCF is closing with a bullish momentum candle supported with volumes.
Today's volumes and candlestick formation indicates strong demand and stock should move to previous swing highs in the coming days.
The stock has been moving along the horizontal support for the past few days which is indicating demand.
One can look for a 8% to 12% gain on deployed capital in this swing trade.
The view is to be discarded in the event of the stock breaking previous swing low.
#NSEindia #Trading #StockMarketindia #Tradingview #SwingTrade

RASHTRIYA CHEMICALS DAILY TIME FRAMEThe Structure looks good to us, waiting for this instrument to correct and then give us these opportunities as shown on this instrument (Price Chart).
Note: Its my view only and its for educational purpose only. Only who has got knowledge about this strategy, will understand what to be done on this setup. its purely based on my technical analysis only (strategies). we don't focus on the short term moves, we look for only for Bullish or Bearish Impulsive moves on the setups after a good price action is formed as per the strategy. we never get into corrective moves. because it will test our patience and also it will be a bullish or a bearish trap. and try trade the big moves.
we do not get into bullish or bearish traps. We anticipate and get into only big bullish or bearish moves (Impulsive Moves). Just ride the Bullish or Bearish Impulsive Move. Learn & Know the Complete Market Cycle.
Buy Low and Sell High Concept. Buy at Cheaper Price and Sell at Expensive Price.
Keep it simple, keep it Unique.
please keep your comments useful & respectful.
Thanks for your support....
Tradelikemee Academy

rcf looking bullishrcf bullish rcf looking bullish
rcf bullish
rcf bullish rcf looking bullish
rcf bullish rcf looking bullish

RCF (Swing):RCF (Swing):
A 20-30% up move is on the cards.
Note: Do your own due diligence before taking any action.

RCF bearish view in short termRCF bearish view in short term: As we can see in chart , RCF has tried to breakout 96 by descending pattern but it is about fail.
To gain some profit, To short now at this level for 3 to 5 % gain with Stop loss 1%.

rcf dz in 98-99 zonercf can be bought in the given dz of 98-99 zone with day closing below 93 as stop loss
targets given

Quick Intraday Trade in RCF Hourly flag pattern breaks out with volume support. A good quality stock that is likely to see a swing in demand post-budget due tomorrow.
Entry - 122-123
Target - 128/132
Sl - Below 118

RCF - Bullish Swing ReversalNSE: RCF is closing with a bullish swing reversal candle supported with volumes.
Today's volumes and candlestick formation indicates strong demand and stock should move to previous swing highs in the coming days.
The stock has been consolidating for the past few days which is indicating demand.
One can look for a 8% to 11% gain on deployed capital in this swing trade.
The view is to be discarded in the event of the stock breaking previous swing low.
#NSEindia #Trading #StockMarketindia #Tradingview #SwingTrade
Disclaimer:
This is for educational purposes only.
