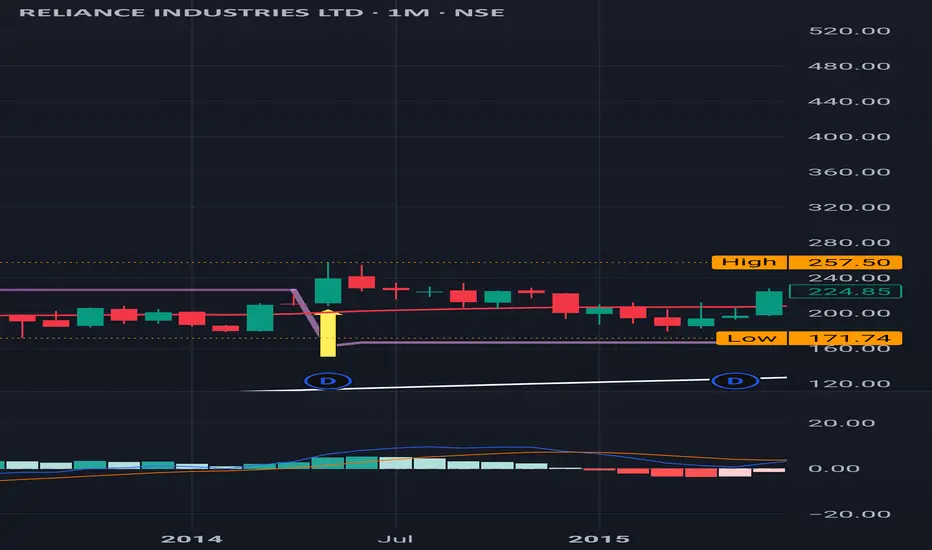
Reliance : A brilliant Journey from May 2014 from 200Reliance : A brilliant Journey from May 2014 from the price level of 200 to until now
It has never been a Sell on a monthly time frame since then.
Even during the Covid time in March 2020 it ditched a Sell signal on a Monthly Time Frame.
It started it's run at around the price level of mere 200 ish in May 2014 and never looked back. Splits / Bonuses/ Dividends / Jio stocks options are all extras apart from the price actions.
It seems this is why it's known as MOTABHAI
( Not a Buy / Sell Recommendation
Do your own due diligence ,Market is subject to risks, This is my own view and for learning only .)
RELIANCE trade ideas
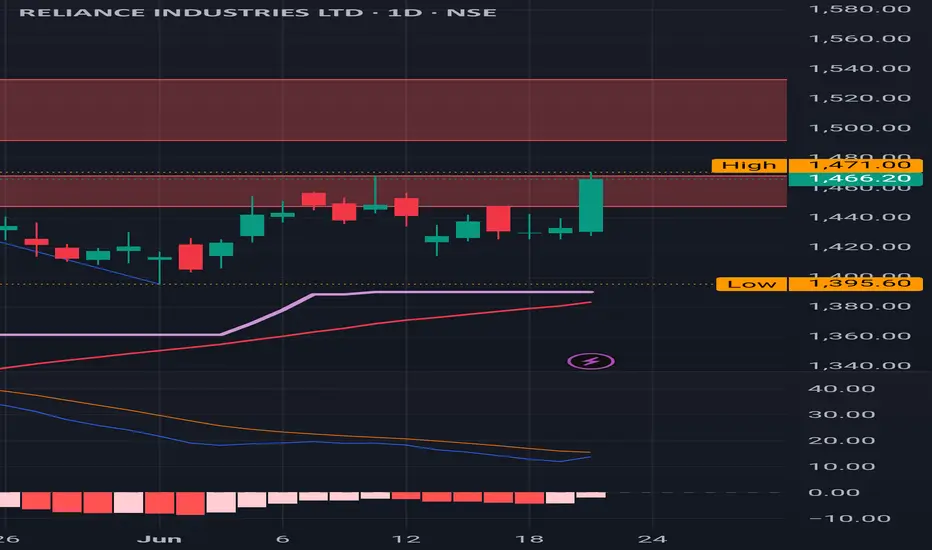
REL : Sitting at an important support level of 1400 ish.
REL : Sitting at an important support level of 1400 ish.
( Not a Buy / Sell Recommendation
Do your own due diligence ,Market is subject to risks, This is my own view and for learning only .)
RELIANCE - PARABOLIC BUYNSE:RELIANCE Weekly parabolic formation may continue further upward trend for short to mid term.
Reliance industries , down trend for few monthsProfit booking and giving an opportunity to buy a round 1260-1230 in some months.
5-6? Month's supply and then demand around 1300-1260.

Reliance industries on weekly channel support Reliance industries #reliance on weekly channel support. Bullish view
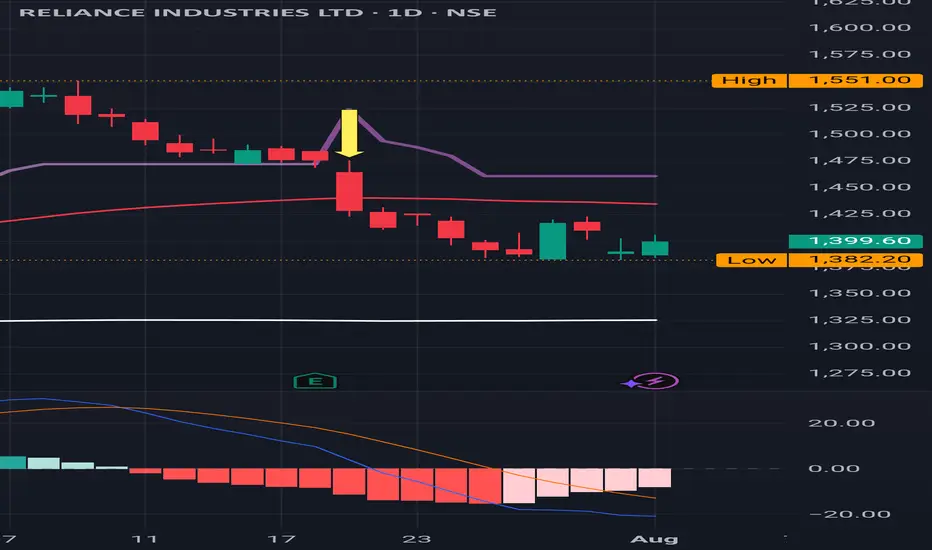
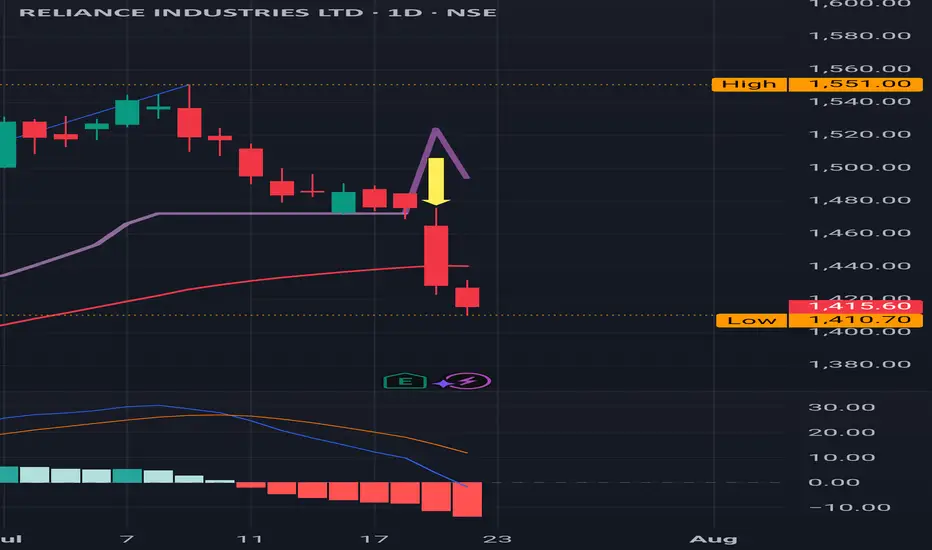
REL : Sell Triggered , around 1400 is an important support levelREL : Sell Triggered .
1390 to 1400 is an important support level.
( Not a Buy / Sell Recommendation
Do your own due diligence ,Market is subject to risks, This is my own view and for learning only .)
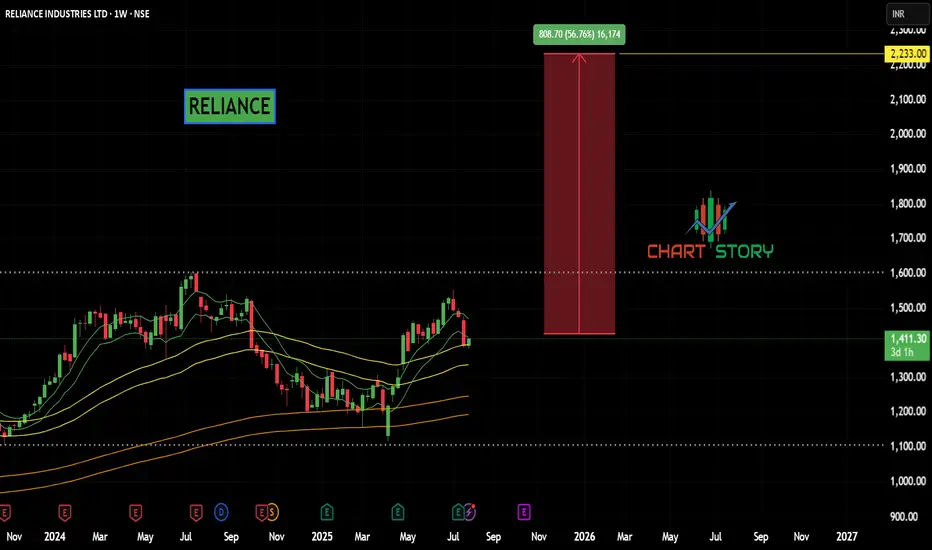
Reliance Industries Stock(India) - {11/07/2025}Educational Analysis says that Reliance Industries (Indian Stock) may give trend Trading opportunities from this range, according to my technical analysis.
Broker - NA
So, my analysis is based on a top-down approach from weekly to trend range to internal trend range.
So my analysis comprises of two structures: 1) Break of structure on weekly range and 2) Trading Range to fill the remaining fair value gap
Let's see what this Stock brings to the table for us in the future.
DISCLAIMER:-
This is not an entry signal. THIS IS FOR EDUCATIONAL PURPOSES ONLY.
I HAVE NO CONCERNS WITH YOUR PROFITS OR LOSS,
Happy Trading,
Stocks & Commodities TradeAnalysis.
My Analysis is:-
Short term trend may be go to the external demand zone.
Long term trend breaks the new high after going from discount zone.
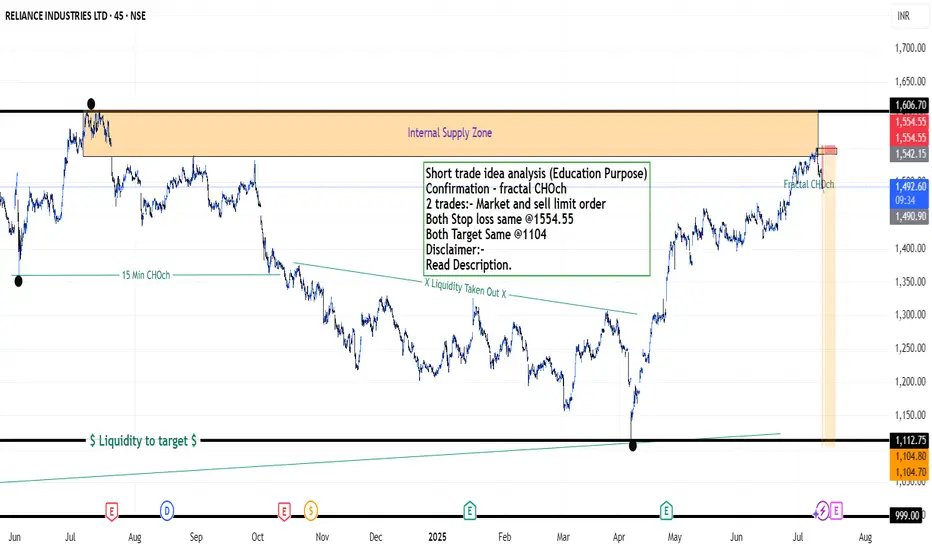
Short trade idea analysis (Education Purpose)
Confirmation - fractal CHOch
2 trades:- Market and sell limit order
Both Stop loss same @1554.55
Both Target Same @1104
Please check the comment section to see how this turned out.
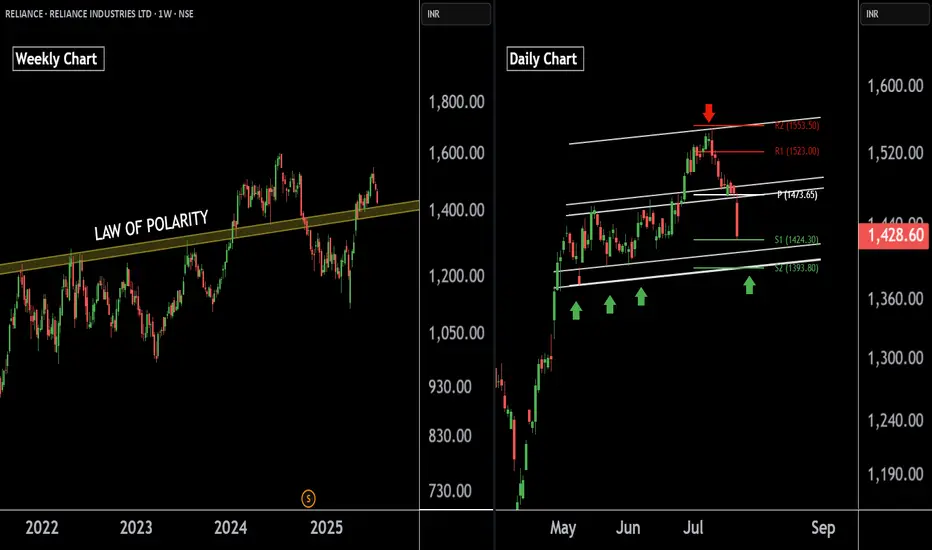
Reliance Industries — Preparing for the Next Bullish Leg !!There are two charts of Reliance Industries — one on the weekly timeframe and the other on the daily timeframe.
On the weekly timeframe:
Reliance industries is trading near (LOP), with a key support zone in the range of 1385–1400.
On the daily timeframe:
Reliance industries is moving in well defined parallel channel with support zone near at 1400-1410.the stock is also taking support at pivot levels S1 and S2, positioned between 1393 and 1422 levels.
If this level is sustain then we may see higher prices in Reliance industries.
Thank You !!
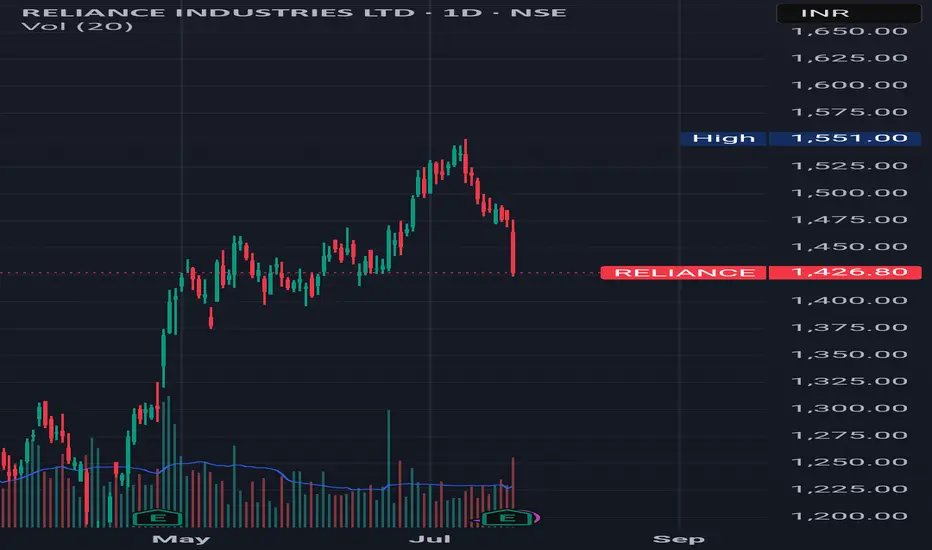
Reliance Entry done @ 1425Reliance Industries Ltd (RIL) shares are experiencing a decline, currently trading around ₹1424-1425. This recent dip comes despite the company reporting robust Q1 FY26 results with a significant 78% year-on-year rise in consolidated net profit to ₹26,994 crore, largely driven by a one-time gain from the stake sale in Asian Paints.
Current Scenario and Key Observations:
* Falling Price: The stock has seen a considerable fall in the past few days, with reports indicating a crash of around 2.7% on BSE today, and a drop of over 6% in July so far.
* Q1 FY26 Performance:
* Net Profit: RIL reported its highest-ever consolidated net profit of ₹26,994 crore for Q1 FY26, significantly beating market estimates.
* Revenue: Revenue from operations increased by 5.3% to ₹2,48,660 crore.
* EBITDA: Consolidated EBITDA jumped 36% to ₹58,024 crore, with EBITDA margin improving to 21.2%.
* Segmental Performance:
* Jio Platforms: Reported a strong 23.9% YoY increase in EBITDA, driven by ARPU growth and operational efficiency. Jio has also surpassed 200 million 5G subscribers.
* Reliance Retail: Posted an 11.3% YoY increase in revenue, though some reports indicate a slowdown in consumer electronics sales and space addition lagging expectations.
* Oil-to-Chemicals (O2C): Saw a slight revenue decline due to weaker crude prices and planned maintenance, but EBITDA climbed due to improved transportation fuel margins.
* Analyst Outlook: Despite the recent fall, many major brokerages have maintained "Buy" or "Overweight" ratings on RIL, with target prices generally ranging from ₹1500 to ₹1767. They remain sanguine about RIL's long-term growth prospects, especially in the New Energy segment, Jio, and Retail.
* Growth Drivers:
* New Energy: RIL is heavily investing in the new energy sector, with plans to commission giga-factories for solar PV, fuel cells, and batteries over the next 4-6 quarters, aiming for a self-funded platform and perpetual growth.
* Digital Services: Continued expansion and growth in Jio Platforms, including 5G deployment and broadband connections.
* Retail Expansion: Ongoing growth and diversification within the retail segment.
* Debt: While the net profit was record-breaking, net debt has slightly increased, reflecting capex intensity in digital infrastructure, new energy, and retail expansion.
Investment Consideration with Stop Loss:
Given the current falling price at ₹1424 and your stated stop loss limit of not more than 5% of your total portfolio, this indicates a cautious approach. While the stock has corrected, many analysts see this as a potential buying opportunity due to strong fundamentals and future growth drivers, especially in the New Energy and Digital segments.
However, it is crucial to consider:
* Volatility: RIL stock is currently exhibiting some volatility.
* Market Sentiment: The broader market conditions and immediate investor reaction to the Q1 results seem to be weighing on the stock despite the strong underlying performance.
* Risk Management: Adhering to your 5% portfolio stop loss is a prudent strategy to mitigate potential downside risk in a volatile market.
What to do with Reliance share after its drubbing today? Reliance looks weak post result however there is no spike in volume of sale that is a good point. The levels from which Reliance can recover seem to be 1427, 1370 or 1323. If we get a closing below 1323 the stock can fall to 1217 or even 1160 levels this is the reading as of now.
The result was looking good but on deeper scrutiny it was understood that major chunk was profit was due to sale of Reliance stake in Asian Paints business. This I think is not liked by the market specially the retail investors.
The stock has tanked close to 3% as of now but there is no huge selling seen from HNIs or MFs (As of now). (This is an assumption looking at the volume of sale) Volumes are similar to normal day of trade.
May be as retail investors panic MFs, HNIs and others might gulp the stock. Cant say clearly. We might reanalyze by end of the day but caution: Do not sell Reliance in Panic. Result was average it was not bad even if we ignore the Asian paint factor so. Currently I am not selling Reliance I am holding on to it. Might add at lower levels.
Disclaimer: The above information is provided for educational purpose, analysis and paper trading only. Please don't treat this as a buy or sell recommendation for the stock or index. The Techno-Funda analysis is based on data that is more than 3 months old. Supports and Resistances are determined by historic past peaks and Valley in the chart. Many other indicators and patterns like EMA, RSI, MACD, Volumes, Fibonacci, parallel channel etc. use historic data which is 3 months or older cyclical points. There is no guarantee they will work in future as markets are highly volatile and swings in prices are also due to macro and micro factors based on actions taken by the company as well as region and global events. Equity investment is subject to risks. I or my clients or family members might have positions in the stocks that we mention in our educational posts. We will not be responsible for any Profit or loss that may occur due to any financial decision taken based on any data provided in this message. Do consult your investment advisor before taking any financial decisions. Stop losses should be an important part of any investment in equity.

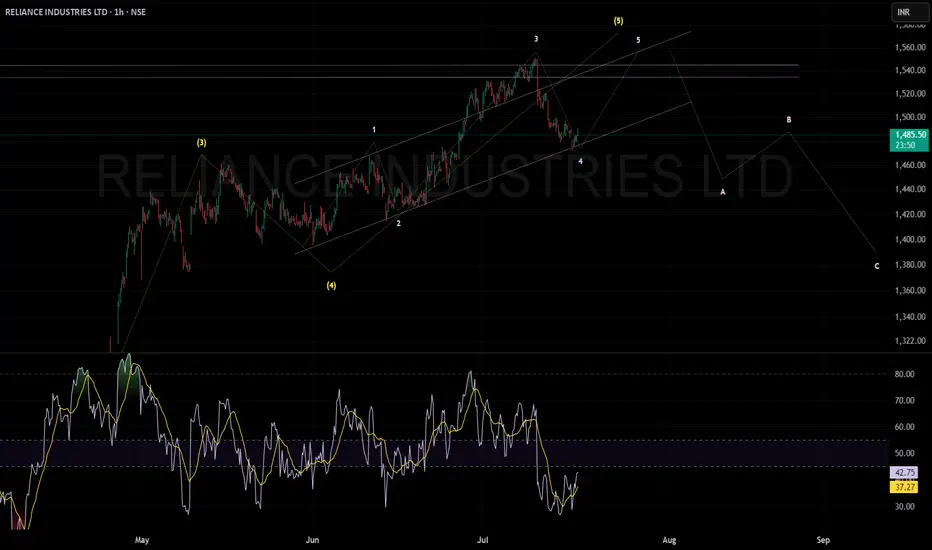
RELIANCE INDUSTRIES CAN MOVE UP IN 5TH WAVEReliance Industries appears poised to complete its final bullish wave with an upward move toward 1550, following which a corrective retracement is likely.
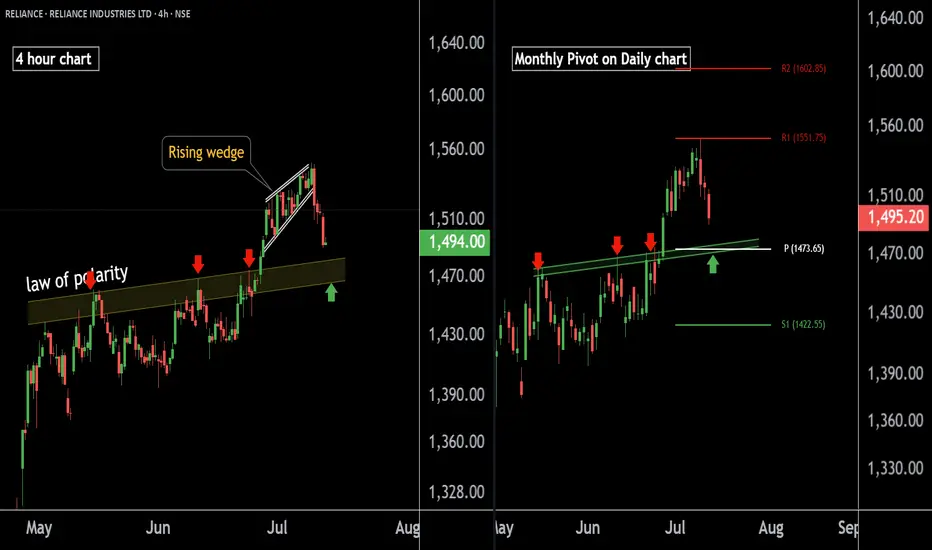
RELIANCE INDUSTRIES at Best Support !! Keep It On Your Radar !!There are two chart of RELIANCE INDUSTRIES on Daily and 4 hour Timeframe.
On the 4-hour timeframe, Reliance is likely to respect its LOP (Line of Polarity) as support, with the support range near 1460-1475.
On the Daily timeframe, the monthly pivot is also positioned around 1473, reinforcing this level as a potential halt or reversal zone.
If this level is sustain we may see higher prices in RELIANCE INDUSTRIES.
Thank You !!!
REL: Red Band is gone
REL : Red band , which was a major resistance level as mentioned in my previous post has disappeared now.
( Not a Buy / Sell Recommendation
Do your own due diligence ,Market is subject to risks, This is my own view and for learning only .)
RELIANCE: Strong Resistance at ₹1600 — Covered Call Setup📉 Chart Context:
Reliance recently rallied ~25% from lows near ₹1,150 to ₹1,450.
The rally stalled at the broken lower trendline of a long-term channel, turning resistance.
Price action now showing rejection around ₹1,435–₹1,450 zone — a historical supply area.
📊 Derivatives Insight:
July ₹1600 CE has the highest Open Interest across the chain: 3.6 lakh+ contracts.
This strike acts as a clear ceiling for market participants.
IV for ₹1600 CE is elevated at 21.8%, indicating overpricing of far OTM risk.
📈 Strategy:
Strategy Bias: Neutral / Mildly Bearish
⚠️ Note: This strategy is suitable only for investors already holding a sizeable position (≥500 shares) in Reliance. It is not a recommendation to buy the stock solely for option writing.
With 500+ shares held, this aligns perfectly for a covered call:
Sell July ₹1600 CE at ₹7.20
Generate passive income (~₹3,600/lot) while capping gains ~13% above CMP
Play on sideways or weakening structure without exiting core position
⚠️ Risk Management:
If Reliance breaches ₹1600 before expiry, gains above this are capped
Position sizing and pledge margin must be managed correctly
📌 Conclusion:
This is a textbook low-risk income strategy using technical resistance, OI data, and IV edge. Unless a fresh breakout emerges, ₹1600 stands firm.
Disclaimer: T his analysis is for educational and informational purposes only. It does not constitute investment advice or a recommendation. Options trading involves risk. Always do your own research or consult a financial advisor before making decisions.
RELIANCE INDUSTRIES at Key Zone !!This is the 1 hour Chart of RELIANCE INDUSTRIES.
Stock has formed a large Broadening Wedge pattern, with a projected target around the 1560 range.
Stock has formed a ascending triangle patterrn with a projected target around the 1560 range.
stock has given a breakout at 1460 range. If it successfully retests and holds this level as support , then we may see higher prices in RELIANCE INDUSTRIES.
Thank you !!

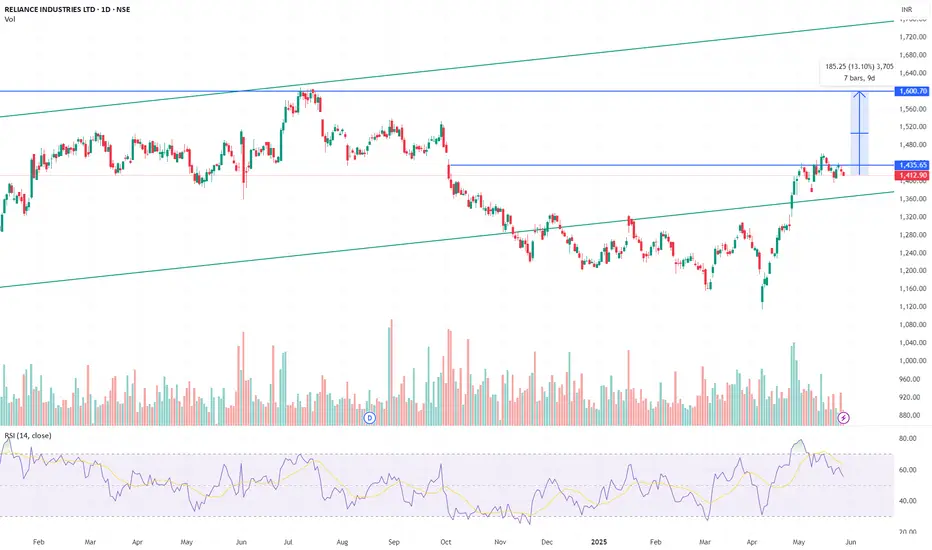
REL: Sitting at the major Red Band Resistance REL : Sitting at the major Red Band Resistance
It has to clear this to reach out to the important peak level of 1608 which happened last year almost the same time in July 2024 .
( Not a Buy / Sell Recommendation
Do your own due diligence ,Market is subject to risks, This is my own view and for learning only .)

RELIANCE Croosed resistance, strong sentiments supporting upmove. Strong trend reversal clearly visible in weekly timeframe.

Reliance Industries looks good for Positional tradeReliance Industries looks good for positional trade, I am planning to enter above 1470 for 1605, 1785 SL below 1270wcb.
Not a buy-sell recommendation, do you own diligence or consult your financial advisor.

Reliance _ Long _ Bullish Flag FormationPotential Flag Formation
Price on the verge of breakout with very good volume.
Support taken at 20 DEMA as well.
Observe tomorrow, how the price reacts.
Enter Long only when the prices are favourable in the lower timeframe.

Reliance : Sitting at the Red Band Resistance
Reliance : Sitting at the major Red Band Resistance.
( Not a Buy / Sell Recommendation
Do your own due diligence ,Market is subject to risks, This is my own view and for learning only .)
RELIANCE- MOTA BHAI ALWAYS MAKES MONEY FOR YOU!!!🔍 CHART ANALYSIS (Weekly Timeframe)
🟩 Trend & Price Structure:
Long-term uptrend is intact (since 2020), though it underwent a correction starting in 2022.
Price has respected a trendline support (dotted black), but recently broke below it and is now attempting a reclaim.
There’s a clear breakout from a falling wedge (pink trendline), which is a bullish reversal pattern.
📊 Key Levels:
Level Significance
₹1111 Historical support (marked as 3-year SL)
₹1300 New proposed stoploss post-breakout
₹1376 Previous resistance zone (now near breakout zone)
₹1608 Recent high (multi-month resistance)
₹2101 Fibonacci 1.618 extension target
₹2060 1.618 fib extension (confirmed by label)
📈 Fibonacci Analysis:
Fibonacci extension from previous impulse wave projects 1.618 at ~₹2060–₹2101.
If ₹1608 is crossed with volume, next rally toward ₹2060–2100 looks probable.
🔁 RSI (Momentum):
RSI (14) = 62.02 – momentum is bullish but not overbought.
No bearish divergence visible; RSI supports bullish continuation.
🔔 Volume Observation:
Last few bullish candles show healthy volume participation, especially in breakout areas.
Indicates smart money interest returning.
✅ SUMMARY OF INTERPRETATION:
✅ Breakout from falling wedge – positive signal.
✅ Reclaiming broken long-term trendline.
✅ New stoploss of ₹1300 is reasonable for medium-term.
✅ ₹1111 stoploss is ideal for long-term investor (3+ years), marking major structural low.
🚀 Potential target = ₹2100+ based on Fibonacci projection.

Bullish structure which is about to break & explodeReliance (TF : 1W)
Bullish structure which is about to break & explode
- Price consolidating & strong bullish built-up visible near trendline
- Trading smoothly above 50 EMA
Once It break & sustain above 1460-75, Reliance is all set to conquer 1550 / 1700 📈

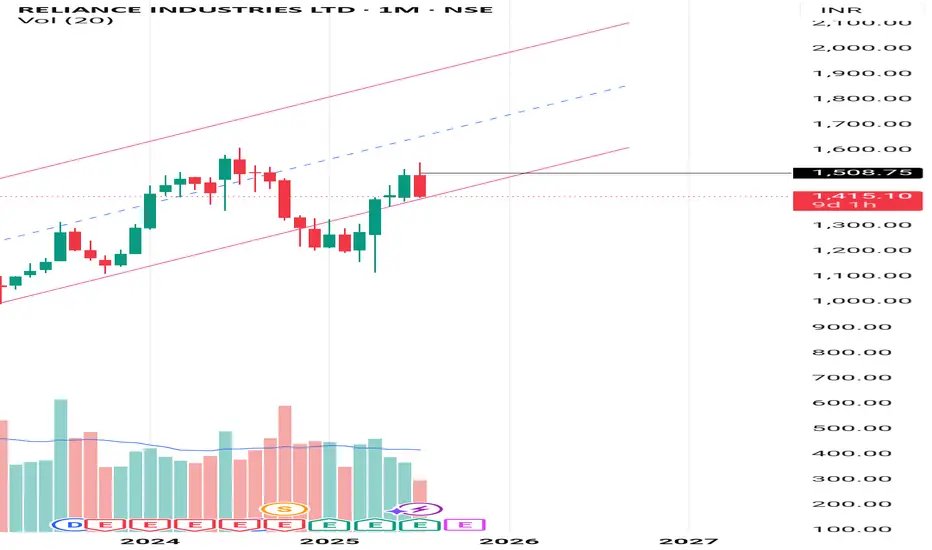
REL Industries: Resistance levels
REL : Resistance levels.
( Not a Buy / Sell Recommendation
Do your own due diligence ,Market is subject to risks, This is my own view and for learning only .)
