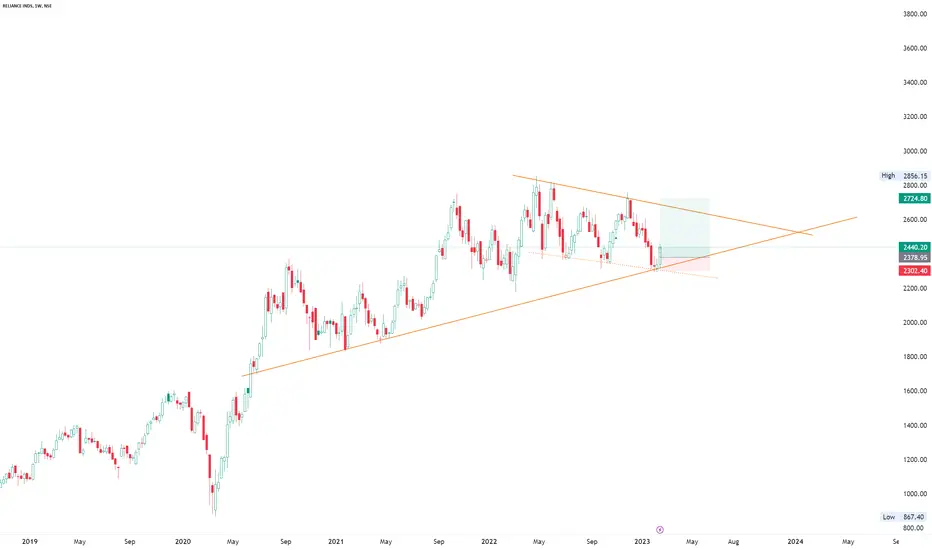
Reliance Ready for -35% Down Move from here..?Reliance/INR Chart Analysis :-
Based on the chart analysis, Reliance is currently trading at ₹2322 and has broken the support level. This could lead to a big down move in the coming months, but there may be good buying opportunities for the long term around ₹1500-₹1600.
The 0.50 Fib Retracement level is at ₹1584, which could lead to a strong bounce from that level. However, this analysis will only hold true if Reliance breaks the ₹2607 level.
My key levels for Reliance:-
support at ₹2218/₹1897/₹1584 and
Resistance at ₹2680
Don't forget to like and appreciate my hard work, and follow me for the latest real-time updates on cryptocurrencies. Thank you!
RELIANCE trade ideas

RELIANCE 4H ,13TH MARCHNSE:RELIANCE
All importants levels are drawn in the chart, work according to risk reward.

RELIANCE.ENTERING THE CRASH MODE.this is the weekly time frame of reliance industries. we can see the negative structure is been formed. the stock is ready to correct itself. the chart of the same is been shared with detail info.


Long Reliance Industries.Reliance looks good on chart.
As its trading above its book value.
Good PE Ratio.
We can Buy Reliance Industries @ 2250-2400 Levels.
Buy on Dip Strategy.
SL Will Be around 2200 and 2150 on Closing Basis.
Short Term Target : 3300/3350
Long-term Target : 4500/6000/6500.
Paisa Banega Traders.
Have a Profitable Day.

Breaking- out from a trendline The scrip is breaking out from a trendline after forming a double bottom, keep this scrip in radar

Reliance Industeries Call option buy opprotunity 2600 Ce 29 marHi every one
2600 CE 29 march Rel you can buy
now date 6 march 2023 today

reliance industries Postive trendreliance industries
hi everyone plan trade
if want ot plan plan buy trade
till 6 march to 7 march 2023 valid this idea

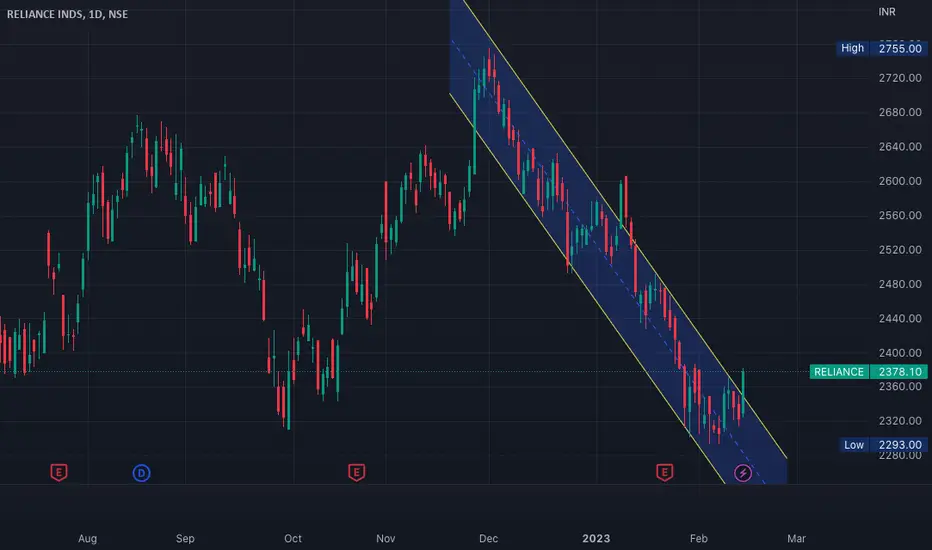
RELIANCE : Break the Consolidation Chenal Reliance Ltd. on Daily TF wee can see the Break the consolidation Pattern in down side with high Volume. RSI Level break at 40 level on daily basis which indicate stock bearish in short term. Momentum also weak on daily, weekly and monthly basis.
Entry : CMP
SL : 2395
Downside Move : 2234,2171

Bearish on RELIANCE Down trend on the day chart. Resistance candle and confirmation candle also on the day chart. Crossed 2 day low on 15 mins chart. 2395 SL. This is a swing trading idea.

Trendline Breakdown in Reliance Industries Limited...Chart is self explanatory.
Disclaimer: This is for demonstration and educational purpose only. This is not buying or selling recommendations. I am not SEBI registered. Please consult your financial advisor before taking any trade.

Reliance Bullish Formation of Head and shoulder pattern, which indicates a downside. Getting rejected at the resistance and trendline for multiple times. Targets are at the levels of Fibonacci.

Relaince industries relaince industries will test the 2385 to 2390 price again, at this price, we can take risk and can go long from this price.


RELIANCE INDReliance ind get rejected from the trendline resistance and huge fall not bullish until it close above 2450

Reliance journey to all time high?Bulls will profit if the trend line breaks, so depend on it. Watch for a crucial breakout to place a long swing trade.
Entry into Green energy-
Another round of capex may get restarted as the company enters into the green energy business. While the return on new investments will take time to come, in the medium term it may help the company improve its ESG score, which matters a lot to global fund houses hence to overall valuations. The recent acquisition in the clean energy space indicates that the company may be more aggressive than the street expected.
The company's annual revenue growth of 47.94% outperformed its 3-year CAGR of 7.29%. (Source: Consolidated Financials)
Weekly stochastic crossover appeared on the week ending Feb 17, 2023. An average price gain of 6.86% within 7 weeks of this signal in the last 10 years.
Stock gave a 3-year return of 66.29% as compared to Nifty 100 which gave a return of 46.6%. (as of the last trading session)
Reliance Industries Ltd.'s share price moved up by 0.42% from its previous close of Rs 2,430.05. Reliance Industries Ltd. stock's last traded price is 2,440.20
-------Source link attached

RELIANCENSE:RELIANCE
One Can Enter Now ! Or Wait for Retest of the Trendline (BO) Or wait for 2377 For better R:R ratio
Note :
1.One Can Go long with a Strict SL below the Trendline or Swing Low of Daily Candle.
2. Close, should be good and Clean.
3. R:R ratio should be 1 :2 minimum
4. Plan as per your RISK appetite
Disclaimer : You are responsible for your Profits and loss, Shared for Educational purpose
Reliance may go down !! but keep trailing your SLThe scrip is looking negative and it can break its previous support. keep in radar. but keep trailing your SL.

Reliance breakout of channel
Reliance breakout from the channel. If it can sustain today and tomorrow , we can go long. Though tomorrow is expected to be a down day, so we should wait for it to show us the direction.

RELIANCE INDReliance ind 1 month chart in which stock is trading at near strong support zone. It's a monthly swing high support I will go long with small stop loss 2280. can gain short term gain. No short view untill it starts trade below 2280.

Reliance Chart Analysis 12/2/23While the price is above the support 2306 price is expected to fall as the current support will get broken
❤️ If you find this helpful and want more FREE forecasts in Trading View
Be sure to leave a comment; let us know how you see this opportunity and forecast.
❤️ Your support is very much 🙏 appreciated!❤️

