Live buying signal in Reliance at 1348Live signal in Reliance at 1348 Khareedo (Buy), Lets see how long it will go up.
Note: This is not a buy/sell trade call. Use stop loss.
RELIANCE trade ideas

Reliance Industries Ltd view for Intraday 28th April #RELIANCE Reliance Industries Ltd view for Intraday 28th April #RELIANCE
Resistance 1301-1305 Watching above 1306 for upside movement...
Support area 1280 Below 1290 ignoring upside momentum for intraday
Watching below 1278 for downside movement...
Above 1290 ignoring downside move for intraday
Charts for Educational purposes only.
Please follow strict stop loss and risk reward if you follow the level.
Thanks,
V Trade Point


Review and plan for 28th April 2025 Nifty future and banknifty future analysis and intraday plan.
Quarterly results.
This video is for information/education purpose only. you are 100% responsible for any actions you take by reading/viewing this post.
please consult your financial advisor before taking any action.
----Vinaykumar hiremath, CMT

Reliance is into bullish zoneMy custom designed indicator names Jin ka Bacha generated signal at price level of 1291 "Khareedo" means to buy, I noticed late and posting now about it, It go to 1325 after signal generated,
Note: This is not a buy/sell call, trade at your own will and use stop loss.

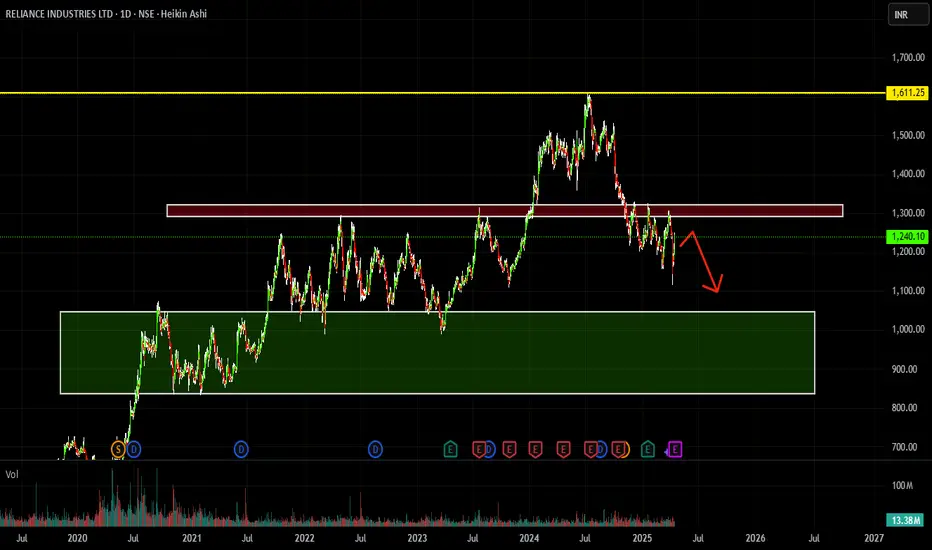
reliance weak next 1330 1260reliance weak next 1330 1260
eliance Industries is a major player in India's economy, spanning industries like oil refining, petrochemicals, retail, and telecommunications. Here's a quick snapshot of its financial standing:

RELIANCE SWING TRADE SETUP📊 Price Action & Trend Analysis
Analyzing market trends using price action, key support/resistance levels, and candlestick patterns to identify high-probability trade setups.
Always follow the trend and manage risk wisely!
Price Action Analysis Interprets Market Movements Using Patterns And Trends On Price Charts.
👉👉👉Follow us for Live Market Views/Trades/Analysis/News Updates.

Reliance Industries Ltd view for Intraday 23rd April #RELIANCE Reliance Industries Ltd view for Intraday 23rd April #RELIANCE
Resistance 1300-1305 Watching above 1280 for upside movement...
Support area 1278 Below 1300 ignoring upside momentum for intraday
Watching below 1278 for downside movement...
Above 1300 ignoring downside move for intraday
Charts for Educational purposes only.
Please follow strict stop loss and risk reward if you follow the level.
Thanks,
V Trade Point

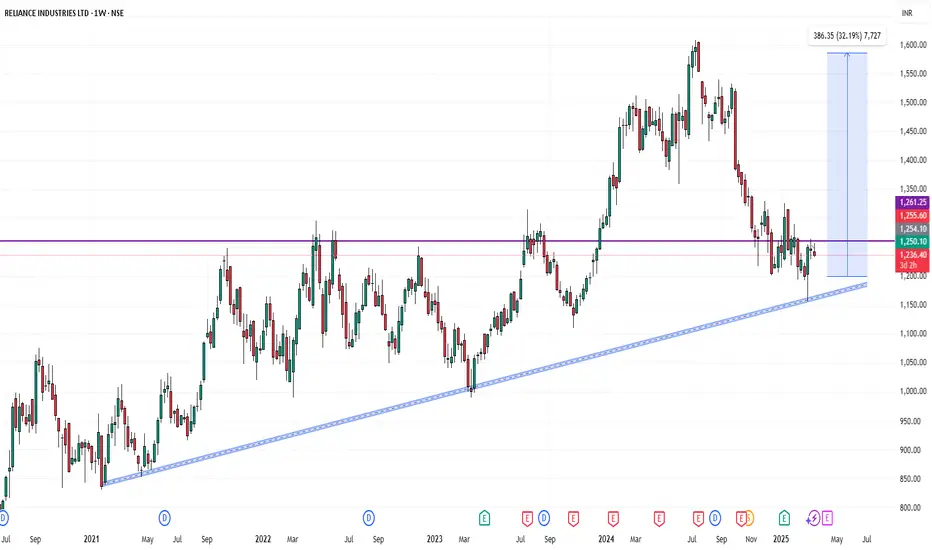
Reliance Industries – Key Weekly Chart Setup | Strong SupportReliance Industries – Key Weekly Chart Setup | Strong Support Zone & Rebound Potential 🚀
Ticker: RELIANCE (NSE)
Timeframe: Weekly
Current Price: ₹1,299.50
Technical Indicators: 200W MA, Fibonacci Retracement, MACD Divergence
🔍 Technical Analysis Insight:
Reliance Industries is currently hovering around its 200-week moving average (MA) (~₹1,220–₹1,225 zone), which has historically acted as a strong long-term support. This confluence with the 61.8% Fibonacci retracement from the previous rally (₹1,608.55 to ₹1,121.55) makes this zone crucial.
Support Zone: ₹1,220–₹1,225
Immediate Resistance: ₹1,362–₹1,380 (near 38.2% retracement & 50W MA)
MACD: Showing bullish crossover on the weekly, along with a positive divergence — signaling potential trend reversal.
📌 If broader markets continue in a rebound phase, Reliance could rally up to 20% in a relatively short span. Targets could be ₹1,460 (23.6% retracement) and ₹1,600 (previous swing high).
🛑 Risk Management Note:
Keep an eye on volume confirmation. A weekly close below ₹1,200 could invalidate the bullish setup and warrant re-evaluation.

Reliance is near to breakout 1346 levelAfter long time reliance is near to breakout level to enter is bullish zone. Breakout level is 1346 and key levels are 1358, 1416, 1489 and 1606.
Note: This is not a buy/sell trade call. Trade at your own will and use stop loss.

Reliance Industries Ltd view for Intraday 23rd April #RELIANCEReliance Industries Ltd view for Intraday 23rd April #RELIANCE
Resistance 1280 Watching above 1285 for upside movement...
Support area 1250 Below 1270 ignoring upside momentum for intraday
Watching below 1245 for downside movement...
Above 1270 ignoring downside move for intraday
Charts for Educational purposes only.
Please follow strict stop loss and risk reward if you follow the level.
Thanks,
V Trade Point

RELIANCE INDUSTRIES LTD short dayThe stock of Reliance Industries is currently exhibiting a clear bearish tone. Price action continues to show weakness, with repeated failed attempts to recover, signaling that sellers remain in control.
The ongoing downward movement suggests a lack of confidence from market participants, with no strong catalysts visible to shift momentum. Selling pressure dominates, while any bounce attempts struggle to hold.
Unless there's a visible change in price behavior or a shift in sentiment, the overall outlook remains negative. Caution is advised, and buyers may want to wait for clearer signs of stability before considering entry.
Reliance seems to be entering Wave 5 Reliance seems to be entering Wave 5 after the corrective Wave 4 ending. Harmonics cycle also support the upside rally from here on.
Is 1600 on the cards or is it going to be truncated Wave 5, Either ways upward rally and rebound is expected from 1200 levels.

Reliance Industries : Already recovered 100 from the support Reliance Industries : Already recovered 100 from the level of 1110 in this week .
Since 2014 it has remained above Supertrend which shows the strength of the script.
It touched 1110 on Oct 2023 and now in April 2025 and recovered in no time.
Next level to watch for is @ 1300
( Not a Buy / Sell Recommendation
Do your own due diligence ,Market is subject to risks, This is my own view and for learning only .)

How to Use the TradingView Search Bar Efficiently 01. Introduction to the TradingView Search Bar
The TradingView Search Bar is one of the most essential tools in your charting journey. Located at the top-left corner of the interface, this feature allows you to instantly switch between stocks, indices, crypto assets, forex pairs, futures, and more — without leaving your current chart tab.
Whether you're a day trader looking for high-volume movers or an investor monitoring global indices, the search bar makes it effortless to pull up symbols with lightning speed.
One of the best parts? You don’t even need to click anything — just start typing on your keyboard while a chart is open, and the search bar automatically activates.
Pro Tip: The TradingView Search Bar supports symbol auto-suggestions with exchange suffixes (like .NS for NSE stocks), making it ultra-fast for Indian markets too.
02. How to Open the Symbol Search Bar
Opening the symbol search bar in TradingView is incredibly intuitive — and can be done in multiple ways depending on how fast you want to move.
Here are the top 3 ways to launch the search bar:
• 🔘 Click the Symbol: Go to the top-left corner of your chart and click the current symbol (e.g., NIFTY or BTCUSD) to open the search panel.
• ⌨️ Start Typing: When your chart is focused, just begin typing any symbol directly — the search window pops up instantly.
• 📚 Use the Watchlist: Open a saved symbol from your Watchlist using a simple click, and it automatically replaces the current chart.
Shortcut Key:
Just press your keyboard and type RELIANCE or NIFTY without clicking anywhere — TradingView immediately opens the search popup.
Works on both Windows and Mac.
03. Extended: Exploring the Search Interface (Tab-by-Tab Breakdown)
The TradingView Symbol Search Interface is more than just a place to look up stock names. It’s a powerful filtering system designed to help traders and investors access any instrument—globally and across asset classes—in just a few clicks. Let’s break down each tab and filter in detail:
🔍 1. Asset Type Tabs
Located at the top of the search panel, these tabs let you narrow down by instrument type:
• All – View all available instruments.
• Stocks – Equity shares from global exchanges (e.g., NSE, NASDAQ, BSE, etc.).
• Funds – Includes ETFs, mutual funds, and index funds.
• Futures – Derivative contracts across commodities, indices, etc.
• Forex – Currency pairs like USDINR, EURUSD, GBPJPY, etc.
• Crypto – Popular cryptocurrencies like BTC, ETH, and exchange pairs.
• Indices – Market indices like NIFTY50, S&P 500, NASDAQ100.
• Bonds – Government and corporate bond listings.
• Economy – Macro-economic indicators like GDP, unemployment, CPI.
• Options – Derivative instruments based on options chain availability.
💡 Pro Tip: Use these tabs before typing a symbol to narrow down your focus instantly.
🌍 2. All Countries Filter
You can choose to see instruments only from specific countries. Selecting this opens a country-wise list showing all supported exchanges under each country.
• USA: NASDAQ, NYSE, CBOE, OTC
• India: NSE, BSE
• UK: LSE
• Germany: XETRA, FWB
🔎 Use Case: If you only want Indian stocks, choose India to limit the results to NSE/BSE only.
🧾 3. All Types Filter (Only under Stocks Tab)
This filter lets you refine your equity instrument type, such as:
• Common Stock
• Preferred Stock
• Depository Receipt (like ADR/GDR)
• Warrant
🔍 Use Case: Great for global investors looking specifically for ADRs or warrants.
🧭 4. All Sectors Filter (Only under Stocks Tab)
This is one of the most powerful tools for equity screening. You can filter stocks based on their sector like:
• Finance
• Technology Services
• Health Technology
• Consumer Durables
• Electronic Technology
• ... and 20+ more industry segments
💼 Use Case: Perfect for sector-based trading or thematic investing.
⚙️ Power Feature: All filters can be used in combination. Example: You can search only Technology sector stocks from India, of Common Stock type — all in seconds.
05: Using the Flag to Add Symbols to Watchlist
The 🚩 flag icon in TradingView allows you to tag symbols with color-coded labels for easy watchlist management. You can organize your stocks by strategy, sector, volatility, or timeframe using these flags.
🎯 What Does the Flag Icon Do?
• Click the 🚩 icon next to any symbol in the search panel.
• Choose from 7 different colors to group stocks by theme.
• Flagged stocks immediately appear under that color in your Watchlist.
You can create multiple groups — like F&O, Crypto, Sectors, Swing Picks — all visually organized.
🔍 06: Smart Search Tricks (Symbol Syntax, Exchanges, Shortcuts)
The TradingView Symbol Search bar supports intelligent filters, shortcuts, and exchange-based syntax to save time and improve accuracy. Mastering these tricks will allow you to switch charts and find instruments faster than ever.
🧠 1. Use Exchange Prefixes
You can directly use exchange prefixes to narrow your search:
NSE: – National Stock Exchange of India
BSE: – Bombay Stock Exchange
NASDAQ: – U.S. Nasdaq-listed stocks
NYSE: – New York Stock Exchange
👉 Example: NSE:RELIANCE shows Reliance on NSE instantly.
💡 2. Partial Name Works Too
You can type partial symbols after the exchange code and TradingView will auto-suggest:
🔎 Example: Typing NSE:REL shows Reliance Industries and others.
⚡ 3. Avoid Full Company Names
Typing full company names like “Reliance Industries Ltd” might not show accurate results quickly. Instead, use ticker codes or shortcuts with exchange prefixes for better precision.
🎯 4. Type Directly to Open Search
No need to click the 🔍 icon! Just start typing on the chart:
Windows/Mac: Type any symbol (e.g. INFY)
Use Arrows: ⬆️ ⬇️ to move between results
Press Enter: to select symbol instantly
🌐 5. Use Filter Tabs Above Search
TradingView lets you filter across:
Markets: All / India / US / Global
Types: Stocks / Crypto / Forex / Futures
Sectors: Banks / Tech / Pharma / Energy
💡 Pro Tip: Combine NSE: + partial ticker + filters to drill down fast without leaving the chart screen


TIME TO SHOW RELIANCE ON RELIANCE - JUST DO NOT MISS THISEverything is pretty much explained in the picture itself.
I am Abhishek Srivastava | SEBI-Certified Research and Equity Derivative Analyst from Delhi with 4+ years of experience.
I focus on simplifying equity markets through technical analysis. On Trading View, I share easy-to-understand insights to help traders and investors make better decisions.
Kindly check my older shared stock results on my profile to make a firm decision to invest in this.
Kindly dm for further assistance it is for free just for this stock.
Thank you and invest wisely.

RIL S/R Support and Resistance Levels:
Support Levels: These are price points (green line/shade) where a downward trend may be halted due to a concentration of buying interest. Imagine them as a safety net where buyers step in, preventing further decline.
Resistance Levels: Conversely, resistance levels (red line/shade) are where upward trends might stall due to increased selling interest. They act like a ceiling where sellers come in to push prices down.
Breakouts:
Bullish Breakout: When the price moves above resistance, it often indicates strong buying interest and the potential for a continued uptrend. Traders may view this as a signal to buy or hold.
Bearish Breakout: When the price falls below support, it can signal strong selling interest and the potential for a continued downtrend. Traders might see this as a cue to sell or avoid buying.
MA Ribbon (EMA 20, EMA 50, EMA 100, EMA 200) :
Above EMA: If the stock price is above the EMA, it suggests a potential uptrend or bullish momentum.
Below EMA: If the stock price is below the EMA, it indicates a potential downtrend or bearish momentum.
Trendline: A trendline is a straight line drawn on a chart to represent the general direction of a data point set.
Uptrend Line: Drawn by connecting the lows in an upward trend. Indicates that the price is moving higher over time. Acts as a support level, where prices tend to bounce upward.
Downtrend Line: Drawn by connecting the highs in a downward trend. Indicates that the price is moving lower over time. It acts as a resistance level, where prices tend to drop.
Disclaimer:
I am not a SEBI registered. The information provided here is for learning purposes only and should not be interpreted as financial advice. Consider the broader market context and consult with a qualified financial advisor before making investment decisions.

Reliance Possible TradeBases pivots n harmonics Reliance possible heading to 1340. Monitoring buy around entry zone. may be to day or tomorrow

Reliance Ind Weekly Chart In weekly Chart Falling Wedge Chart Pattern formation Lets See Make Or Break

Reliance Ind, IHNS Formation on Daily TFafter a down trend Reversal Pattern Found Let`s What Happen In coming Days

Reliance Industries📈 Reliance Industries Breakout Alert – ₹1241 Key Level Breached 🚀
Reliance Industries has successfully broken out above a strong resistance zone near ₹1241, indicating a potential bullish move ahead. This level acted as a critical supply zone in the past, and the breakout with volume confirmation adds strength to the trend.
🔍 Technical Highlights:
Breakout Level: ₹1241
Volume: Above average (confirming strength)
Trend: Bullish
Next Resistance Zones: ₹1265 / ₹1290
Support Zones: ₹1220 / ₹1200 (previous resistance now acting as support)
Reliance short term analysis :• Looking at the weekly chart for Reliance, the Stochastic Oscillator (Stoch) is indicating potential strength as it hovers near the oversold zone.
• This suggests that the stock might be nearing a potential buying opportunity from a long-term perspective.
• However, it's crucial to consider the daily chart for a more short-term view. On the daily chart is trading close to the overbought zone, which implies that the stock might be overextended in the short term and due for a price correction.
• This divergence in signals between the weekly and daily charts suggests the possibility of a short-selling opportunity in Reliance.
