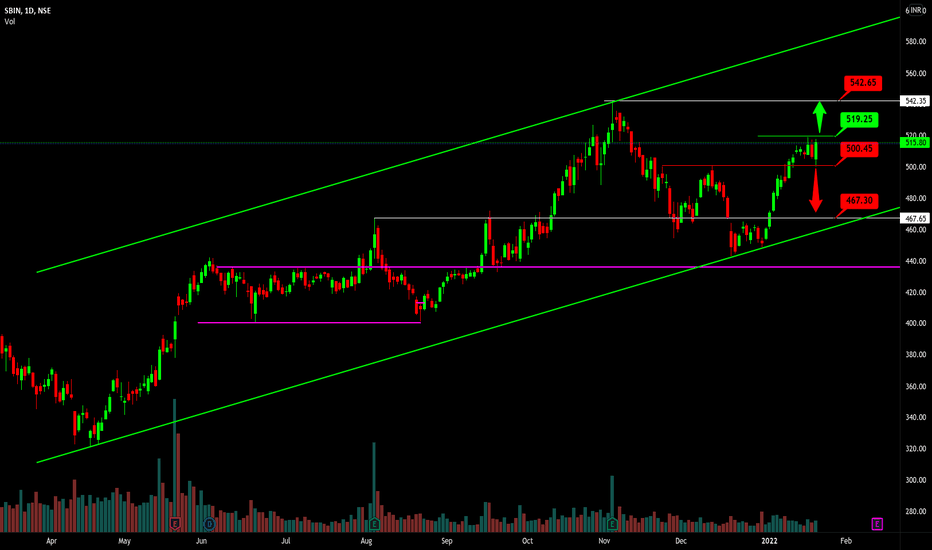
SBIN-Long opportunitySBI- C&H pattern BO Delivery volume and momentum is high. Future OI rising. Longby Swapnil_Bhongade0
My love affairs with Bank Nifty, makes it a new HIGH 39370 We were mildly bearish on Bank Nifty early on but around 1:30 pm there was trend reversal and we switched our mildly bearish to bullish view and just keep trailing SL. TK cross at 38850 MACD cross over ADX>25 DI+>DI It crosses VWAP, VWMA, took support from Super trend. 09:33by brainmassfinance0
SBI - breakout - longSBI has a breakout as shown on the charts. As suggested in the previous linked post, my bias was long SBI and this could be a good time to add to position. If price comeback and closes back into the channel, we look to close short term trades. Positional investors can hold and look for further price changesLongby LoveForCharts0
SBIOne can buy sbi now with target 471/494. It is for informational purpose only. Do your own anlaysis before taking any position. Consult your advisor before investing.Longby Sahil12345Updated 331
Strong stocks with 21 ema Use 21 ema with super trend and Rai When a stock in its 52 week high zone with positive relative strength and Rai above 50 corrects to 21 ema and takes support with a target of 1:2/1:3 as your risk apitite by mansurifaizan8820
SBIN highly bullish PSU rally mark my word -sbin very big target yet to come -initial halt at 500 then rally Longby xc71150
SBI Breakout - will wait for retestSBI seems to be breaking out form a consolidation zone , Volumes not supporting much though. Will wait for retest. Longby kashyaomilindkale0
SBIN RESISTANCE BROKENStrong resistance was placed around 470 in SBIN which was tested thrice but failed. Ascending triangle pattern was formed on daily chart and the resistance level was finally broken now. Investors can buy at any levels. Traders can wait for a pullback and enter. Longby Vulnerable_human_x3
SBIN - LONG setupThis has been my fav stock in the PSU banks space. Chart looks great on both Weekly and Daily charts. At a very critical stage right now and at resistance zone. Nice strong candle for closing and firmly up at the resistance zone, but RSI on both Weekly and Daily charts bullish and no where near overbought zones. 200 daily MA below should be strong support and positive trending stock. Keep an eye on the whole PSU space for action. Longby LoveForCharts0
State Bank of IndiaSBIN should be in your watchlist. Its gave breakout once its retest or come to the near of breakout level then it should be buying candidate.by akshaygupta16111
#sbin strong buy above trendline SBI ready for fresh breakout as per technical possible small correction and after ready for breakout keep eye for upcoming day possible to give good gain before Result. For Live call & Stock query Follow Equity advance prediction Longby NiftyViewAbhishek0
SBINNSE:SBIN Please note that we are not a SEBI Registered Investor Adviser/PMS/ Broking House. All the contents over here are for educational purposes only and are not investment advice or recommendations offered to any person(s) with respect to the purchase or sale of the stocks / futures and options. You are also requested to apply your prudence and consult your advisers in case you choose to act on any such content available as WE claims no responsibilities for any of your actions or any outcome of such actionby TrAder_3101_0
short SBINHuge resistance and upper triangular pattern suggest bearish move for SBINShortby brucewayne010
Sell - SBINSBI - Strong support at CMP 437 Looking Weak We will see a drop 1st Target - 429 2nd target - 418 Dont enter at CMP - MACD & RSI - Daily & Weekly looking Weak Only once we see a reversal enter.by arunspotonUpdated 4
SBI DALY CHART narrowing wedge pattern , can touch 450-452 in intraday , positional 468-470 Longby ambrishtiwari6750
#SBIN #POSITIONAL (FOR EDUCATIONAL PURPOSE)SBIN buy above 442 Target 466 sl 433 NIFTY BANKNIFTYLongby vinod02110
Banknifty Harmonics and price actionWeekly analysis of SBIN.Surely a negative divergence is seen as price is maiking higher highs, but rsi is making lower low in weekly time frame. Consider making new position only and only when rsi breaks the trendline and closes above 70. Then new rally will start again towards 700. And if anytime prices goes below 430 short SBIN for a target of 400. Join my tele channel (BANKNIFTY HARMONICS AND PRICE ACTION) for positional trades in banknifty.by Harmonicstrader0
SBIN at bottom line of triangle good time to enter Taking support from 30min 44sma at bottom of triangle /trendline Bank nifty seesms breaking out SBIN is in uptrend 15min RSI taken multiple support at 40 Longby AsifHussain9995
SBIN STATE BANK OF INDIA 22 SEP 2021HLO THERE 1. its is a anaylsis/ prediction of pattern forming in sbin 2. a head and shoulder pattern is forming (note :not fully formed ) 3. a shoukder and head is formed and 200ema is near 440 if price reject from there clearly its a H&S pattern 4. let wait and watch what happens (and also act according to situation not blindly go with idea thanks........ Shortby sarpreetdh440
BUY | Intraday |20-09-2021 SBI has been taking support at 50% retracement level and is waiting for a breakout. A buy can be initiated on the breakout for the mentioned targets and stop-loss. The only condition would be to see how bank nifty performs tomorrow. Although it is expected to give a good rise given its retracement is complete. DISCLAIMER: The ideas are merely for information purposes. Please consult your financial advisors before taking any trade. Trade at your own risk.Longby The_Chartereds2