SCI-Wave 5 loading ?!!Analysis:
Shipping Corp of India appears to have completed a classic Elliott Wave 1–2–3–4 structure, with Wave 5 potentially underway.
✅ Wave 3 shows strong momentum, and
✅ Wave 4 found support near the 0.618–0.786 retracement zone – a healthy corrective pullback.
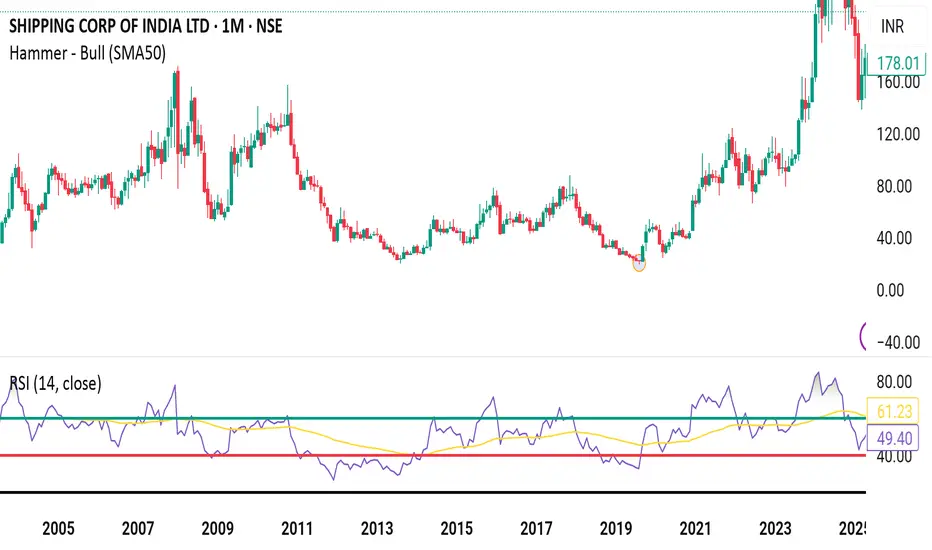
✅ RSI is rising from the 40 zone and now sits near 60, indicating growing strength without being overbought.
✅ Price structure remains intact – Wave 4 didn’t overlap with Wave 1, preserving the impulse validity.
🎯 Potential Target for Wave 5:
1.0 ext: ₹238
Extended move could stretch to ₹280–₹300+ if volume and momentum sustain.
Support Zones:
₹174 (previous breakout zone)
₹151–133 (Fibo clusters)
Watchlist Note: A breakout above ₹240 with volume could confirm the start of Wave 5. Keep an eye on price action and RSI divergence during this rally.
SCI trade ideas

Hammer candlestick//@version=5
indicator("Hammer Alert", overlay=true)
// Hammer Candlestick Definition (basic)
isHammer = close > open and
((high - low) > 3 * (close - open)) and
((close - low) / (0.001 + high - low) > 0.6) and
((open - low) / (0.001 + high - low) > 0.6)
// Plot Hammer Pattern on Chart
plotshape(isHammer, style=shape.labelup, location=location.belowbar, color=color.green, size=size.small, text="Hammer")
// Alert Condition
alertcondition(isHammer, title="Hammer Detected", message="Hammer candlestick pattern detected!")
Technical Analysis with Elliott Waves: A Combined ApproachHello friends, Welcome to RK Charts!
This Educational Post is based on technical analysis, specifically how to initiate analysis on a chart, and what points to consider. This is purely for Educational purposes.
This is not a trading or investing tip or advisory. Rather, it's a comprehensive guide on how to easily analyze a chart, intended for educational purposes. I hope that by reading and understanding this post, you'll gain valuable knowledge and insights. Your focused effort to understand this will surely provide you with something valuable and easy to grasp.
Let's dive in, During technical analysis, what we had observed certain points in this chart, I'm highlighting them here:
1. Resistance line breakout, where the price has closed above it.
2. The volume within that breakout.
3. The price closing above Weekly Exponential Moving Averages.
4. Elliott Wave Counts.
5. Projected Target along with Invalidation level as per Elliott Wave theory.
6. Projected Duration for Projected Targets.
Breakout of Resistance zone with Good Volume intensity:
So, friends, here we can clearly see on the chart that this is a weekly time frame chart of Shipping Corporation of India Limited. Over the last eleven months, from July 2024, the price has been falling, remaining largely bearish, but has now broken out of Curved Resistance Trendline for the first time with a bullish candle on Weekly (Closing basis), accompanied by good volume intensity.
Alongside this, the price has sustained and closed above Major EMAs:
- 50-Weekly Exponential moving average (red line plotted on the chart)
- 100-Weekly Exponential moving average (blue line plotted on the chart)
- 200-Weekly Exponential moving average (black line plotted on the chart)
on the weekly time frame.
Elliott Wave Theory:
Considering the Elliott Wave structure, if we look at it theoretically, the top it made on July 2024, was the completion of Wave III. After that, it completed Wave IV in 7 swings (WXY) and is now possibly moving higher, making higher lows. It has closed above the moving averages, broken out of the Curved Trendline, and has strong volume. So, possibly, we are unfolding an impulse Wave V.
In Elliott Wave Theory, the invalidation level means that the price should not go below that level, which in this case is the low of Wave IV at ₹130. If the price goes below that level for any reason, even by a single point, our wave counts will be invalidated, and we'll have to re-analyze the chart.
That's why we call it the invalidation level. Analysts and traders also refer to it as a stop-loss level. So, in Elliott Wave Theory, our wave counts remain valid as long as the price stays above the invalidation level and doesn't trigger it.
Now, regarding the target, if we take the measurement of Wave IV and calculate its 1.236 level, the target for Wave V should be above the high of Wave III. According to Elliott Wave Theory, the projected target for Wave V is near ₹440, which is the 1.236 Fibonacci level.
Projected Duration for Projected Targets:
In the chart analysis we conducted, where we prospectively projected a target, if everything goes right and the invalidation level is not triggered, what could be the duration of this target? It will definitely take more than a medium-term duration, maybe even a long-term duration.
This is because each candle represents a week, and we're currently looking at the weekly time frame. Since the fourth wave has just ended and the fifth wave is upcoming, it will take a long-term duration
I am not Sebi registered analyst.
My studies are for educational purpose only.
Please Consult your financial advisor before trading or investing.
I am not responsible for any kinds of your profits and your losses.
Most investors treat trading as a hobby because they have a full-time job doing something else.
However, If you treat trading like a business, it will pay you like a business.
If you treat like a hobby, hobbies don't pay, they cost you...!
Hope this post is helpful to community
Thanks
RK💕
Disclaimer and Risk Warning.
The analysis and discussion provided on in.tradingview.com is intended for educational purposes only and should not be relied upon for trading decisions. RK_Chaarts is not an investment adviser and the information provided here should not be taken as professional investment advice. Before buying or selling any investments, securities, or precious metals, it is recommended that you conduct your own due diligence. RK_Chaarts does not share in your profits and will not take responsibility for any losses you may incur. So Please Consult your financial advisor before trading or investing.

looks like up side-SCI On the SCI daily chart, we can see that the price action is showing momentum and strength. This is particularly true as the price approaches the upper boundary of the weekly range, as shown here The price recently broke out and has been moving higher. With a relatively high volume, this looks like the breakout is here to stay.

Trendline Breakout - SCITechnical Analysis:
Current Price: ₹188 (as of May 16, 2025, around 3:30 PM IST, it's trading slightly higher around ₹188.50).
Stop Loss: A closing basis stop loss at ₹170 is a good way to manage risk. If the price closes below this level, it would suggest the breakout might be invalid.
Targets: Your targets of ₹200 and ₹240 represent potential upside levels based on the breakout.
Trendline Breakout: This is a key bullish signal, suggesting the stock might have overcome a period of resistance and could move higher.
Time Frame: A 1 to 3-month timeframe is reasonable for these targets to be achieved if the breakout holds.
Key Factors to Consider:
Breakout Confirmation: It's crucial to see if the breakout is sustained with good trading volume in the coming days. A breakout without strong volume can sometimes be a false signal.
Market Conditions: The overall market sentiment and the performance of the shipping sector will play a role in SCI's price movement.
Q4FY25 Results: SCI is scheduled to announce its Q4 and full-year results ending March 31, 2025, on Friday, May 16, 2025. These results and any dividend announcement could significantly impact the stock price.
Technical Indicators: While you've identified a trendline breakout, it can be helpful to look at other technical indicators (like RSI, MACD) to see if they support the bullish momentum.
Potential Upside and Targets:
Target 1 (₹200): This represents an approximate 6.4% upside from the current price.
Target 2 (₹240): This represents a more significant potential upside of around 27.6%.
Risk Management:
Your strict stop loss at ₹170 limits your potential downside to about 10.6% from the current price.

SCI NSE Bearish channel BO WTF NEW Stock Analysis
Trade Plan: SCI
Entry: 50% of the total quantity at 243 DTF Close, with an additional 50% added at 274 DTF Close Price.
Stop Loss: 203
Target 1: 345
Target 2: NA
Hold for a period of 11 months to 1 year or until the target 1 is reached.
Chart Pattern:
The stock experienced a Pullback period of 5Months after touching an all-time high (ATH) of 383 .
Technical Indicators:
The stock’s daily timeframe (DTF) shows that the price is currently trading above the 50-day exponential moving average (EMA) and the 20-day EMA below the 50EMA. The EMAs are in Transitional sequence of alignment. The Stock is at good price point where the 50EMA and 200EMA are very close and the 20EMA has curved upwards.A potential bullish trend in formation on the DTF/WTF timeframe.
Volume Analysis:
There has been a surge up of volumes on the buy side for a Month now. Take entry as recommended in Trade Plan.
Prioritize Watch List:
Keep this stock in your watch list for further analysis and potential trading opportunities.
Disclaimer: This information is solely for educational and reference purposes. Trading inherently carries risks, and it’s crucial to exercise caution and conduct comprehensive research before making any investment decisions. Make sure you have a well-defined risk appetite, proper position sizing, and a stop-loss order based on your risk tolerance. Review your Portfolio periodically. Exit positions when the price closes 7-8% below your entry point or Earlier basis your Risk profile. Consider re-entering the market when the trend reverses.Before engaging in any trading activities, it is paramount to thoroughly comprehend these technical analysis concepts and conduct extensive research on the stocks you are interested in. Furthermore, consulting a certified financial advisor can offer valuable insights and guidance before making investment decisions.
Technical Analysis Concepts:
Multiple Time Frame Analysis (MTFA):
Daily Time Frame (DTF): Used for short-term analysis and identifying trends.
Weekly Time Frame (WTF): Provides a broader perspective and helps in trend confirmation.
Monthly Time Frame (MTF): Ideal for long-term analysis and trend analysis.
All-Time High (ATH): The highest price reached on a specific chart.
Lifetime High (LTH): The highest price reached over the entire chart’s history.
Stop Loss (SL): A predetermined price level at which an investment is automatically exited to limit potential losses.
Swing Trade: A trading strategy that involves holding positions for a significant period, typically few weeks to months.
Positional Trade: A trading strategy that aims to capitalize on long-term trends and position oneself accordingly.
CHART PATTERNS
Rounding Bottom Cup/Handle (RBC&H): A pattern that signals a potential reversal from a downtrend.
Breakout (BO): A price move closure above a resistance or below a support level.
Flag & Pole BO: (F&P BO) Bullish Continuation Pattern
Consolidation : Price Typically Swings between a Range for a period of Time Long or Short basis the MTFA. Breaking out of this range UPWARDS is an opportunity to BUY and DOWNWARDS is SELL opportunity.
Moving Averages:
Exponential Moving Average (EMA): A popular moving average that places more weight on recent price data.
Volume-Weighted Moving Average (VWMA): A moving average that gives more weight to high-volume stocks.
Fibonacci Retracement/Extension:
Trend-based Fibonacci Retracement: Used to identify potential support and resistance levels during re-tracements.
Trend-based Fibonacci Extension: Used to identify potential breakout levels during extensions.

SHIPPING CORP INDIA LONGSCI
MTF Analysis Price
SCIYearly Demand 118
SCI 6 Month Demand 175
SCIQtrly Demand BUFL 175
SCIMonthly Demand 175
SCIWeekly Demand 208
SCIDaily Demand DMIP 1,137
ENTRY -1 Long 208
SL 160
RISK 48
REWARD 192
Target as per Entry-1 400
RR 4
Last High 382
Last Low 190
ENTRY -2 Long 175
SL 160
RISK 15
REWARD 192
Target as per Entry-2 367
RR 13
Last High 382
Last Low 190
Trade Set Up
Buy Volume -1 As per Entry-1 1,000
Buy Volume -2 As per Entry-2 1,000
Average Buy Price 192
Trade Value 383,250
SL Point 160
RISK 32
Exit Target 367
Target Value 734,000
Profit Target 350,750
RISK Value 63,250
Risk to Reward 6

Shipping Corp of India buy 208 & 175SCI
MTF Analysis
SCIYearly Demand 117.46
SCI 6 Month Demand BUFL 175
SCIQtrly Demand BUFL 175
SCIMonthly Demand 175
SCIWeekly Demand 217
SCIDaily Demand DMIP 208
ENTRY -1 Long 208
SL 189
RISK 19
Target as per Entry 400
Target Points 192
Risk To Reward 1":10
ENTRY -2 Long 175
SL 145
RISK 30
Target as per Entry 400
Target Points 225
Risk To Reward 1 ::8


Shipping Corp of India Ltd (SCI) - Weekly Head & Shoulders Watch🚨 Potential Head and Shoulders Pattern forming on the weekly chart, signaling a possible bearish reversal if the neckline breaks.
📊 Key Levels to Watch:
Neckline Support: ₹203.32 - A weekly close below this level would confirm the pattern, potentially leading to a further decline.
Right Shoulder Resistance: ₹235 - ₹270 - If the price fails to break above this zone, the bearish structure stays intact.
🎯 Target (upon breakdown): ₹177.72 - Calculated from the height of the head to the neckline.
📈 Alternative Bullish Scenario: If SCI breaks above ₹270.60, the Head and Shoulders pattern could be invalidated, potentially signaling bullish momentum towards previous highs.
📉 Indicators:
RSI shows a slight uptick, but a downward trend could confirm the bearish setup.
Watch for a volume spike if the price breaks the neckline, as it would strengthen the bearish case.
Disclaimer: T his is not financial advice. Keep an eye on these levels and manage your risk accordingly!

Go Long in Shipping Corporation of India LtdIn intraday we are observing that SCI is trying to breakout of a trendline. If on daily time frame, it closes above 238 then we can except targets of 250, 272 & 290.
Stoploss against this investment can be placed near 218.

Shipping Corporation SCI at SupportStock P/E - 12.8
EPS growth 5Years - 40.3 %
Current ratio - 1.25
The idea shared is to spread awareness about the concepts of technical analysis.
The stock discussed is an example to illustrate support & resistance trading.

SCIHi guys,
In this chart i Found a Demand Zone in SCI CHART for Positional entry,
Observed these Levels based on price action and Demand & Supply.
*Don't Take any trades based on this Picture.
... because this chart is for educational purpose only not for Buy or Sell Recommendation..
Thank you

Still bearish as the technical are indicatingThere is no candle reversal or sign of a slowdown; it may break 200 before it corrects itself; this seems very much distribution alike.

Shipping Corporation Of India Limited Shipping Corporation Of India Limited As the Price in correction mode Presenting Buying opportunity, RSI is also indicating Bullish hidden divergence wait for the price to retrace deeper into the support for better risk to reward.

SHIPPING CORP OF INDIA LTD S/RSupport and Resistance Levels:
Support Levels: These are price points (green line/share) where a downward trend may be halted due to a concentration of buying interest. Imagine them as a safety net where buyers step in, preventing further decline.
Resistance Levels: Conversely, resistance levels (red line/shade) are where upward trends might stall due to increased selling interest. They act like a ceiling where sellers come in to push prices down.
Breakouts:
Bullish Breakout: When the price moves above resistance, it often indicates strong buying interest and the potential for a continued uptrend. Traders may view this as a signal to buy or hold.
Bearish Breakout: When the price falls below support, it can signal strong selling interest and the potential for a continued downtrend. Traders might see this as a cue to sell or avoid buying.
20 EMA (Exponential Moving Average):
Above 20 EMA: If the stock price is above the 20 EMA, it suggests a potential uptrend or bullish momentum.
Below 20 EMA: If the stock price is below the 20 EMA, it indicates a potential downtrend or bearish momentum.
Trendline: A trendline is a straight line drawn on a chart to represent the general direction of a data point set.
Uptrend Line: Drawn by connecting the lows in an upward trend. Indicates that the price is moving higher over time. Acts as a support level, where prices tend to bounce upward.
Downtrend Line: Drawn by connecting the highs in a downward trend. Indicates that the price is moving lower over time. It acts as a resistance level, where prices tend to drop.
RSI: RSI readings greater than the 70 level are overbought territory, and RSI readings lower than the 30 level are considered oversold territory.
Combining RSI with Support and Resistance:
Support Level: This is a price level where a stock tends to find buying interest, preventing it from falling further. If RSI is showing an oversold condition (below 30) and the price is near or at a strong support level, it could be a good buy signal.
Resistance Level: This is a price level where a stock tends to find selling interest, preventing it from rising further. If RSI is showing an overbought condition (above 70) and the price is near or at a strong resistance level, it could be a signal to sell or short the asset.
Disclaimer:
I am not a SEBI registered. The information provided here is for learning purposes only and should not be interpreted as financial advice. Consider the broader market context and consult with a qualified financial advisor before making investment decisions.

Just A View - At Support - SCI📊 Script: SCI
📊 Sector: Shipping
📊 Industry: Shipping
Key highlights: 💡⚡
📈 Script is trading at support level which is near 280 which was previously working as resistance, we may see some good rally from here.
📈 One can go for Swing Trade.
⏱️ C.M.P 📑💰- 285
🟢 Target 🎯🏆 - 300/330
⚠️ Important: Always maintain your Risk & Reward Ratio.
✅Like and follow to never miss a new idea!✅
Disclaimer: I am not SEBI Registered Advisor. My posts are purely for training and educational purposes.
Eat🍜 Sleep😴 TradingView📈 Repeat 🔁
Happy learning with trading. Cheers!🥂

SCI-2-BOTTOM'S UP - ACCUMULATESHIPPING CORPORATION OF I NSE:SCI NDIA
CMP: 208.80; RSI:48.50
As per wave analysis, ABC correction cycle is at its last stage and fomed a bottom. Its good time to accumulate the script, between Rs: 200 to 225 zone; stop loss: 187
Upside breakout will be confirmed once script closes above 238.5
Near Term Target 1: 280; (2 months time frame)
Medium Term Traget 2 : 330-351 (4 months time frame)

SCI | SWING | LONG Price is making a base near ATH
Price is being followed by 20 EMA, showing momentum
Volume dry-up

SCILooks Good on charts.
Above all Key EMA.
Short term Target 290.
Do Like ,Comment , Follow for regular Updates...
Keep Learning ,Keep Earning...
Disclaimer : This is not a Buy or Sell recommendation. I am not SEBI Registered. Please consult your financial advisor before making any investments . This is for Educational purpose only.

SCI Breakout happend in this stock with rising 200dma.
Keep your risk and reward ratios according to your own preferance.
This is for educational purpose, do your own research before investing.

Double Bottom Breakout - Keep An Eye - SCI📊 Script: SCI
📊 Sector: Shipping
📊 Industry: Shipping
Key highlights: 💡⚡
📈 Script is going to give breakout of Double Bottom on daily chart keep an eye on stock, breakout is above 235.
📈 Script is trading at upper band of BB.
📈 MACD is giving crossover .
📈 Already Crossover in Double Moving Averages.
📈 Right now RSI is around 61.
📈 One can go for Swing Trade.
BUY ONLY ABOVE 235
⏱️ C.M.P 📑💰- 232
🟢 Target 🎯🏆 - 254
⚠️ Stoploss ☠️🚫 - 223
⚠️ Important: Always maintain your Risk & Reward Ratio.
✅Like and follow to never miss a new idea!✅
Disclaimer: I am not SEBI Registered Advisor. My posts are purely for training and educational purposes.
Eat🍜 Sleep😴 TradingView📈 Repeat 🔁
Happy learning with trading. Cheers!🥂

Breakout Sci gave triangle pattern breakout with good volumes, highly recommended for buy atleast 2-3 months , my upside target is 40%+ from 230 .
