SENSEX S/R for 26/3/24Support and Resistance Levels: In technical analysis, support and resistance levels are significant price levels where buying or selling interest tends to be strong. They are identified based on previous price levels where the price has shown a tendency to reverse or find support.
Support levels are represented by the green line and green shade, indicating areas where buying interest may emerge to prevent further price decline.
Resistance levels are represented by the red line and red shade, indicating areas where selling pressure may arise to prevent further price increases. Traders often consider these levels as potential buying or selling opportunities.
Breakouts: Breakouts occur when the price convincingly moves above a resistance level (red shade) or below a support level (green shade). A bullish breakout above resistance suggests the potential for further price increases, while a bearish breakout below support suggests the potential for further price declines. Traders pay attention to these breakout signals as they may indicate the start of a new trend or significant price movement.
Disclosure: I am not SEBI registered. The information provided here is for learning purposes only and should not be interpreted as financial advice. It is important to consult with a qualified financial advisor before making any investment decisions. Tweets neither advice nor endorsement.
SENSEX trade ideas

SENSEX S/R for 22/3/24Support and Resistance Levels: In technical analysis, support and resistance levels are significant price levels where buying or selling interest tends to be strong. They are identified based on previous price levels where the price has shown a tendency to reverse or find support.
Support levels are represented by the green line and green shade, indicating areas where buying interest may emerge to prevent further price decline.
Resistance levels are represented by the red line and red shade, indicating areas where selling pressure may arise to prevent further price increases. Traders often consider these levels as potential buying or selling opportunities.
Breakouts: Breakouts occur when the price convincingly moves above a resistance level (red shade) or below a support level (green shade). A bullish breakout above resistance suggests the potential for further price increases, while a bearish breakout below support suggests the potential for further price declines. Traders pay attention to these breakout signals as they may indicate the start of a new trend or significant price movement.
Disclosure: I am not SEBI registered. The information provided here is for learning purposes only and should not be interpreted as financial advice. It is important to consult with a qualified financial advisor before making any investment decisions. Tweets neither advice nor endorsement.

sensex expriry on 22 march 2024 support and resistance levels are marked on chart indicator shows entry stop and target level too. gap up opening was today for tomorrow we can expect a gap filling move if it breakes down the support level look for breakout and breakdown of resistance and support level

SENSEX S/R for 21/3/24Support and Resistance Levels: In technical analysis, support and resistance levels are significant price levels where buying or selling interest tends to be strong. They are identified based on previous price levels where the price has shown a tendency to reverse or find support.
Support levels are represented by the green line and green shade, indicating areas where buying interest may emerge to prevent further price decline.
Resistance levels are represented by the red line and red shade, indicating areas where selling pressure may arise to prevent further price increases. Traders often consider these levels as potential buying or selling opportunities.
Breakouts: Breakouts occur when the price convincingly moves above a resistance level (red shade) or below a support level (green shade). A bullish breakout above resistance suggests the potential for further price increases, while a bearish breakout below support suggests the potential for further price declines. Traders pay attention to these breakout signals as they may indicate the start of a new trend or significant price movement.
Disclosure: I am not SEBI registered. The information provided here is for learning purposes only and should not be interpreted as financial advice. It is important to consult with a qualified financial advisor before making any investment decisions. Tweets neither advice nor endorsement.

SENSEX S/R for 20/3/24Support and Resistance Levels: In technical analysis, support and resistance levels are significant price levels where buying or selling interest tends to be strong. They are identified based on previous price levels where the price has shown a tendency to reverse or find support.
Support levels are represented by the green line and green shade, indicating areas where buying interest may emerge to prevent further price decline.
Resistance levels are represented by the red line and red shade, indicating areas where selling pressure may arise to prevent further price increases. Traders often consider these levels as potential buying or selling opportunities.
Breakouts: Breakouts occur when the price convincingly moves above a resistance level (red shade) or below a support level (green shade). A bullish breakout above resistance suggests the potential for further price increases, while a bearish breakout below support suggests the potential for further price declines. Traders pay attention to these breakout signals as they may indicate the start of a new trend or significant price movement.
Keltner Channel: The Keltner Channel is a technical indicator that uses an exponential moving average (EMA) and an average true range (ATR) to create an upper and lower channel around the price action. The upper line of the channel represents the upper limit of the average range, and the lower line represents the lower limit. Traders can use the Keltner Channel to identify potential long and short positions.
Long Position: A long position may be considered when the price is trading above the upper line of the Keltner Channel. This suggests that the price is trading above the average range and may continue in an upward trend, potentially offering buying opportunities.
Short Position: A short position may be considered when the price is trading below the lower line of the Keltner Channel. This suggests that the price is trading below the average range and may continue in a downward trend, potentially offering selling opportunities.
Disclosure: I am not SEBI registered. The information provided here is for learning purposes only and should not be interpreted as financial advice. It is important to consult with a qualified financial advisor before making any investment decisions. Tweets neither advice nor endorsement.

SENSEX S/R for 19/3/24Support and Resistance Levels: In technical analysis, support and resistance levels are significant price levels where buying or selling interest tends to be strong. They are identified based on previous price levels where the price has shown a tendency to reverse or find support.
Support levels are represented by the green line and green shade, indicating areas where buying interest may emerge to prevent further price decline.
Resistance levels are represented by the red line and red shade, indicating areas where selling pressure may arise to prevent further price increases. Traders often consider these levels as potential buying or selling opportunities.
Breakouts: Breakouts occur when the price convincingly moves above a resistance level (red shade) or below a support level (green shade). A bullish breakout above resistance suggests the potential for further price increases, while a bearish breakout below support suggests the potential for further price declines. Traders pay attention to these breakout signals as they may indicate the start of a new trend or significant price movement.
Keltner Channel: The Keltner Channel is a technical indicator that uses an exponential moving average (EMA) and an average true range (ATR) to create an upper and lower channel around the price action. The upper line of the channel represents the upper limit of the average range, and the lower line represents the lower limit. Traders can use the Keltner Channel to identify potential long and short positions.
Long Position: A long position may be considered when the price is trading above the upper line of the Keltner Channel. This suggests that the price is trading above the average range and may continue in an upward trend, potentially offering buying opportunities.
Short Position: A short position may be considered when the price is trading below the lower line of the Keltner Channel. This suggests that the price is trading below the average range and may continue in a downward trend, potentially offering selling opportunities.
Disclosure: I am not SEBI registered. The information provided here is for learning purposes only and should not be interpreted as financial advice. It is important to consult with a qualified financial advisor before making any investment decisions. Tweets neither advice nor endorsement.

SENSEX S/R for 18/3/24Support and Resistance Levels: In technical analysis, support and resistance levels are significant price levels where buying or selling interest tends to be strong. They are identified based on previous price levels where the price has shown a tendency to reverse or find support.
Support levels are represented by the green line and green shade, indicating areas where buying interest may emerge to prevent further price decline.
Resistance levels are represented by the red line and red shade, indicating areas where selling pressure may arise to prevent further price increases. Traders often consider these levels as potential buying or selling opportunities.
Breakouts: Breakouts occur when the price convincingly moves above a resistance level (red shade) or below a support level (green shade). A bullish breakout above resistance suggests the potential for further price increases, while a bearish breakout below support suggests the potential for further price declines. Traders pay attention to these breakout signals as they may indicate the start of a new trend or significant price movement.
Keltner Channel: The Keltner Channel is a technical indicator that uses an exponential moving average (EMA) and an average true range (ATR) to create an upper and lower channel around the price action. The upper line of the channel represents the upper limit of the average range, and the lower line represents the lower limit. Traders can use the Keltner Channel to identify potential long and short positions.
Long Position: A long position may be considered when the price is trading above the upper line of the Keltner Channel. This suggests that the price is trading above the average range and may continue in an upward trend, potentially offering buying opportunities.
Short Position: A short position may be considered when the price is trading below the lower line of the Keltner Channel. This suggests that the price is trading below the average range and may continue in a downward trend, potentially offering selling opportunities.
Disclosure: I am not SEBI registered. The information provided here is for learning purposes only and should not be interpreted as financial advice. It is important to consult with a qualified financial advisor before making any investment decisions. Tweets neither advice nor endorsement.

Sensex Intraday Setup for Friday 15 March,2024I have posted two charts: the First is to understand the Intraday, and the second is my short-term view. Today is the weekly closing and the day that decides the market trend for next week. 72,500 is the last hope for the Bulls and a very critical zone, so keep an eye on these levels. They can help you play for the maximum today or in the upcoming days.
Intraday Range: 72,900 to 73,400 ( A more comprehensive range and good for the Options sellers who love to sell Options
Long above 73,400 for the target of 73,700/73,900
Short Below: 72,900 for the target to 72,600/72,500
Trade Accordingly

SENSEX S/R for 15/3/24Support and Resistance Levels: In technical analysis, support and resistance levels are significant price levels where buying or selling interest tends to be strong. They are identified based on previous price levels where the price has shown a tendency to reverse or find support.
Support levels are represented by the green line and green shade, indicating areas where buying interest may emerge to prevent further price decline.
Resistance levels are represented by the red line and red shade, indicating areas where selling pressure may arise to prevent further price increases. Traders often consider these levels as potential buying or selling opportunities.
Breakouts: Breakouts occur when the price convincingly moves above a resistance level (red shade) or below a support level (green shade). A bullish breakout above resistance suggests the potential for further price increases, while a bearish breakout below support suggests the potential for further price declines. Traders pay attention to these breakout signals as they may indicate the start of a new trend or significant price movement.
Keltner Channel: The Keltner Channel is a technical indicator that uses an exponential moving average (EMA) and an average true range (ATR) to create an upper and lower channel around the price action. The upper line of the channel represents the upper limit of the average range, and the lower line represents the lower limit. Traders can use the Keltner Channel to identify potential long and short positions.
Long Position: A long position may be considered when the price is trading above the upper line of the Keltner Channel. This suggests that the price is trading above the average range and may continue in an upward trend, potentially offering buying opportunities.
Short Position: A short position may be considered when the price is trading below the lower line of the Keltner Channel. This suggests that the price is trading below the average range and may continue in a downward trend, potentially offering selling opportunities.
Disclosure: I am not SEBI registered. The information provided here is for learning purposes only and should not be interpreted as financial advice. It is important to consult with a qualified financial advisor before making any investment decisions. Tweets neither advice nor endorsement.

SENSEX S/R for 14/3/24Support and Resistance Levels: In technical analysis, support and resistance levels are significant price levels where buying or selling interest tends to be strong. They are identified based on previous price levels where the price has shown a tendency to reverse or find support.
Support levels are represented by the green line and green shade, indicating areas where buying interest may emerge to prevent further price decline.
Resistance levels are represented by the red line and red shade, indicating areas where selling pressure may arise to prevent further price increases. Traders often consider these levels as potential buying or selling opportunities.
Breakouts: Breakouts occur when the price convincingly moves above a resistance level (red shade) or below a support level (green shade). A bullish breakout above resistance suggests the potential for further price increases, while a bearish breakout below support suggests the potential for further price declines. Traders pay attention to these breakout signals as they may indicate the start of a new trend or significant price movement.
Keltner Channel: The Keltner Channel is a technical indicator that uses an exponential moving average (EMA) and an average true range (ATR) to create an upper and lower channel around the price action. The upper line of the channel represents the upper limit of the average range, and the lower line represents the lower limit. Traders can use the Keltner Channel to identify potential long and short positions.
Long Position: A long position may be considered when the price is trading above the upper line of the Keltner Channel. This suggests that the price is trading above the average range and may continue in an upward trend, potentially offering buying opportunities.
Short Position: A short position may be considered when the price is trading below the lower line of the Keltner Channel. This suggests that the price is trading below the average range and may continue in a downward trend, potentially offering selling opportunities.
Disclosure: I am not SEBI registered. The information provided here is for learning purposes only and should not be interpreted as financial advice. It is important to consult with a qualified financial advisor before making any investment decisions. Tweets neither advice nor endorsement.

SENSEX S/R for 13/3/24Support and Resistance Levels: In technical analysis, support and resistance levels are significant price levels where buying or selling interest tends to be strong. They are identified based on previous price levels where the price has shown a tendency to reverse or find support.
Support levels are represented by the green line and green shade, indicating areas where buying interest may emerge to prevent further price decline.
Resistance levels are represented by the red line and red shade, indicating areas where selling pressure may arise to prevent further price increases. Traders often consider these levels as potential buying or selling opportunities.
Breakouts: Breakouts occur when the price convincingly moves above a resistance level (red shade) or below a support level (green shade). A bullish breakout above resistance suggests the potential for further price increases, while a bearish breakout below support suggests the potential for further price declines. Traders pay attention to these breakout signals as they may indicate the start of a new trend or significant price movement.
Keltner Channel: The Keltner Channel is a technical indicator that uses an exponential moving average (EMA) and an average true range (ATR) to create an upper and lower channel around the price action. The upper line of the channel represents the upper limit of the average range, and the lower line represents the lower limit. Traders can use the Keltner Channel to identify potential long and short positions.
Long Position: A long position may be considered when the price is trading above the upper line of the Keltner Channel. This suggests that the price is trading above the average range and may continue in an upward trend, potentially offering buying opportunities.
Short Position: A short position may be considered when the price is trading below the lower line of the Keltner Channel. This suggests that the price is trading below the average range and may continue in a downward trend, potentially offering selling opportunities.
Disclosure: I am not SEBI registered. The information provided here is for learning purposes only and should not be interpreted as financial advice. It is important to consult with a qualified financial advisor before making any investment decisions. Tweets neither advice nor endorsement.

SENSEX S/R for 12/3/24Support and Resistance Levels: In technical analysis, support and resistance levels are significant price levels where buying or selling interest tends to be strong. They are identified based on previous price levels where the price has shown a tendency to reverse or find support.
Support levels are represented by the green line and green shade, indicating areas where buying interest may emerge to prevent further price decline.
Resistance levels are represented by the red line and red shade, indicating areas where selling pressure may arise to prevent further price increases. Traders often consider these levels as potential buying or selling opportunities.
Breakouts: Breakouts occur when the price convincingly moves above a resistance level (red shade) or below a support level (green shade). A bullish breakout above resistance suggests the potential for further price increases, while a bearish breakout below support suggests the potential for further price declines. Traders pay attention to these breakout signals as they may indicate the start of a new trend or significant price movement.
Keltner Channel: The Keltner Channel is a technical indicator that uses an exponential moving average (EMA) and an average true range (ATR) to create an upper and lower channel around the price action. The upper line of the channel represents the upper limit of the average range, and the lower line represents the lower limit. Traders can use the Keltner Channel to identify potential long and short positions.
Long Position: A long position may be considered when the price is trading above the upper line of the Keltner Channel. This suggests that the price is trading above the average range and may continue in an upward trend, potentially offering buying opportunities.
Short Position: A short position may be considered when the price is trading below the lower line of the Keltner Channel. This suggests that the price is trading below the average range and may continue in a downward trend, potentially offering selling opportunities.
Disclosure: I am not SEBI registered. The information provided here is for learning purposes only and should not be interpreted as financial advice. It is important to consult with a qualified financial advisor before making any investment decisions. Tweets neither advice nor endorsement.

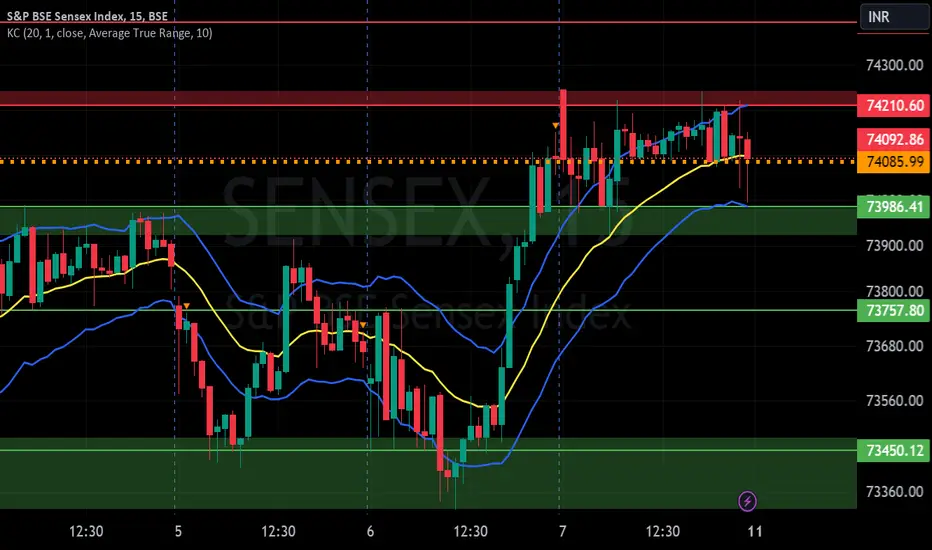
SENSEX- Intraday Levels - 11th March 2024* Approx movement expect is around +/- 270 or 640
If SENSEX Sustain above 74119 then 74367 Strong level then74525 then 74664 then 74897 then 75089 above this more bullish
if SENSEX Sustain Below 73921 then 73825 then 73746 then below this bearish, then 73574 then 73449 strong level then 73289 then last hope will be 73125
Consider some buffer points in above levels.
Please do your due diligence before trading or investment.
**Disclaimer -
I am not a SEBI registered analyst or advisor. I does not represent or endorse the accuracy or reliability of any information, conversation, or content. Stock trading is inherently risky and the users agree to assume complete and full responsibility for the outcomes of all trading decisions that they make, including but not limited to loss of capital. None of these communications should be construed as an offer to buy or sell securities, nor advice to do so. The users understands and acknowledges that there is a very high risk involved in trading securities. By using this information, the user agrees that use of this information is entirely at their own risk.
Thank you.

based on week trendFocus on these level for next day if we check week based then may be it will happening

SENSEX S/R for 11/3/24Support and Resistance Levels: In technical analysis, support and resistance levels are significant price levels where buying or selling interest tends to be strong. They are identified based on previous price levels where the price has shown a tendency to reverse or find support.
Support levels are represented by the green line and green shade, indicating areas where buying interest may emerge to prevent further price decline.
Resistance levels are represented by the red line and red shade, indicating areas where selling pressure may arise to prevent further price increases. Traders often consider these levels as potential buying or selling opportunities.
Breakouts: Breakouts occur when the price convincingly moves above a resistance level (red shade) or below a support level (green shade). A bullish breakout above resistance suggests the potential for further price increases, while a bearish breakout below support suggests the potential for further price declines. Traders pay attention to these breakout signals as they may indicate the start of a new trend or significant price movement.
Keltner Channel: The Keltner Channel is a technical indicator that uses an exponential moving average (EMA) and an average true range (ATR) to create an upper and lower channel around the price action. The upper line of the channel represents the upper limit of the average range, and the lower line represents the lower limit. Traders can use the Keltner Channel to identify potential long and short positions.
Long Position: A long position may be considered when the price is trading above the upper line of the Keltner Channel. This suggests that the price is trading above the average range and may continue in an upward trend, potentially offering buying opportunities.
Short Position: A short position may be considered when the price is trading below the lower line of the Keltner Channel. This suggests that the price is trading below the average range and may continue in a downward trend, potentially offering selling opportunities.
Disclosure: I am not SEBI registered. The information provided here is for learning purposes only and should not be interpreted as financial advice. It is important to consult with a qualified financial advisor before making any investment decisions. Tweets neither advice nor endorsement.
BOMBAY SENSEX #BSE #SENSEX Pullback completed after #Adani fraudInvesting in #INDIA has been a trade of a lifetime
Based on a burgeoning middle class and best low population demographics in the world
Indians want to FLEX and move up the income brackets
Highly motivated and educated
I believe the pullback after the Adani scandal is over
And the #Nifty can resume its long term bull and finally meet its inverse and head and shoulder from the Covid debacle.

SENSEX S/R for 7/3/24Support and Resistance Levels: In technical analysis, support and resistance levels are significant price levels where buying or selling interest tends to be strong. They are identified based on previous price levels where the price has shown a tendency to reverse or find support.
Support levels are represented by the green line and green shade, indicating areas where buying interest may emerge to prevent further price decline.
Resistance levels are represented by the red line and red shade, indicating areas where selling pressure may arise to prevent further price increases. Traders often consider these levels as potential buying or selling opportunities.
Breakouts: Breakouts occur when the price convincingly moves above a resistance level (red shade) or below a support level (green shade). A bullish breakout above resistance suggests the potential for further price increases, while a bearish breakout below support suggests the potential for further price declines. Traders pay attention to these breakout signals as they may indicate the start of a new trend or significant price movement.
Keltner Channel: The Keltner Channel is a technical indicator that uses an exponential moving average (EMA) and an average true range (ATR) to create an upper and lower channel around the price action. The upper line of the channel represents the upper limit of the average range, and the lower line represents the lower limit. Traders can use the Keltner Channel to identify potential long and short positions.
Long Position: A long position may be considered when the price is trading above the upper line of the Keltner Channel. This suggests that the price is trading above the average range and may continue in an upward trend, potentially offering buying opportunities.
Short Position: A short position may be considered when the price is trading below the lower line of the Keltner Channel. This suggests that the price is trading below the average range and may continue in a downward trend, potentially offering selling opportunities.
Disclosure: I am not SEBI registered. The information provided here is for learning purposes only and should not be interpreted as financial advice. It is important to consult with a qualified financial advisor before making any investment decisions. Tweets neither advice nor endorsement.

SENSEX S/R for 6/3/24Support and Resistance Levels: In technical analysis, support and resistance levels are significant price levels where buying or selling interest tends to be strong. They are identified based on previous price levels where the price has shown a tendency to reverse or find support.
Support levels are represented by the green line and green shade, indicating areas where buying interest may emerge to prevent further price decline.
Resistance levels are represented by the red line and red shade, indicating areas where selling pressure may arise to prevent further price increases. Traders often consider these levels as potential buying or selling opportunities.
Breakouts: Breakouts occur when the price convincingly moves above a resistance level (red shade) or below a support level (green shade). A bullish breakout above resistance suggests the potential for further price increases, while a bearish breakout below support suggests the potential for further price declines. Traders pay attention to these breakout signals as they may indicate the start of a new trend or significant price movement.
Keltner Channel: The Keltner Channel is a technical indicator that uses an exponential moving average (EMA) and an average true range (ATR) to create an upper and lower channel around the price action. The upper line of the channel represents the upper limit of the average range, and the lower line represents the lower limit. Traders can use the Keltner Channel to identify potential long and short positions.
Long Position: A long position may be considered when the price is trading above the upper line of the Keltner Channel. This suggests that the price is trading above the average range and may continue in an upward trend, potentially offering buying opportunities.
Short Position: A short position may be considered when the price is trading below the lower line of the Keltner Channel. This suggests that the price is trading below the average range and may continue in a downward trend, potentially offering selling opportunities.
Disclosure: I am not SEBI registered. The information provided here is for learning purposes only and should not be interpreted as financial advice. It is important to consult with a qualified financial advisor before making any investment decisions. Tweets neither advice nor endorsement.

SENSEX- Intraday Levels - 5th March 2024
If SENSEX Sustain above 73930 then 73994 to 74058 then 74361 to 74376 then 74603 to 74666 strong level then 74897 to 74914
if SENSEX Sustain Below 73810 then 73386 to 73322 then 73289 to 73275 then 72945 then 72777 to 72713 Consider some buffer points in above levels.
Please do your due diligence before trading or investment.
**Disclaimer -
I am not a SEBI registered analyst or advisor. I does not represent or endorse the accuracy or reliability of any information, conversation, or content. Stock trading is inherently risky and the users agree to assume complete and full responsibility for the outcomes of all trading decisions that they make, including but not limited to loss of capital. None of these communications should be construed as an offer to buy or sell securities, nor advice to do so. The users understands and acknowledges that there is a very high risk involved in trading securities. By using this information, the user agrees that use of this information is entirely at their own risk.
Thank you.

SENSEX S/R for 5/3/24Support and Resistance Levels:
Based on the price action, you have to identify two significant levels: the red line acting as resistance and the green line acting as support. Additionally, there have marked red and green shades to represent resistance and support zones, respectively.
Support: The green line and green shade represent support levels. These levels are where the price tends to find buying interest, preventing it from falling further. Traders can consider these levels as potential buying opportunities.
Resistance: The red line and red shade represent resistance levels. These levels are where the price tends to encounter selling pressure, preventing it from rising further. Traders can consider these levels as potential selling opportunities.
Breakouts: If the price breaks above the resistance zone (red shade) convincingly, it may indicate a bullish breakout, and the price could move higher to the next resistance level. On the other hand, if the price breaks below the support zone (green shade) convincingly, it may indicate a bearish breakout, and the price could move lower to the next support level.
Keltner Channel:
The Keltner Channel is a technical indicator that uses an exponential moving average (EMA) to create an upper and lower channel around the price action. Traders can use this channel to identify potential long and short positions.
Long Position: If the price is above the upper line of the Keltner Channel, it may indicate a potential long opportunity, as it suggests the price is trading above the average range and might continue in an upward trend.
Short Position: If the price is below the lower line of the Keltner Channel, it may indicate a potential short opportunity, as it suggests the price is trading below the average range and might continue in a downward trend.
Disclosure: I am not SEBI registered. I just wanted to let you know that the information provided here is for learning purposes only. Please consult your financial advisor before making any decisions. Tweets neither advice nor endorsement.

SENSEX S/R for 4/3/24Support and Resistance Levels:
Based on the price action, you have to identify two significant levels: the red line acting as resistance and the green line acting as support. Additionally, there have marked red and green shades to represent resistance and support zones, respectively.
Support: The green line and green shade represent support levels. These levels are where the price tends to find buying interest, preventing it from falling further. Traders can consider these levels as potential buying opportunities.
Resistance: The red line and red shade represent resistance levels. These levels are where the price tends to encounter selling pressure, preventing it from rising further. Traders can consider these levels as potential selling opportunities.
Breakouts: If the price breaks above the resistance zone (red shade) convincingly, it may indicate a bullish breakout, and the price could move higher to the next resistance level. On the other hand, if the price breaks below the support zone (green shade) convincingly, it may indicate a bearish breakout, and the price could move lower to the next support level.
Keltner Channel:
The Keltner Channel is a technical indicator that uses an exponential moving average (EMA) to create an upper and lower channel around the price action. Traders can use this channel to identify potential long and short positions.
Long Position: If the price is above the upper line of the Keltner Channel, it may indicate a potential long opportunity, as it suggests the price is trading above the average range and might continue in an upward trend.
Short Position: If the price is below the lower line of the Keltner Channel, it may indicate a potential short opportunity, as it suggests the price is trading below the average range and might continue in a downward trend.
Disclosure: I am not SEBI registered. I just wanted to let you know that the information provided here is for learning purposes only. Please consult your financial advisor before making any decisions. Tweets neither advice nor endorsement.

SENSEX S/R for 1/3/24Support and Resistance Levels:
Based on the price action, you have to identify two significant levels: the red line acting as resistance and the green line acting as support. Additionally, there have marked red and green shades to represent resistance and support zones, respectively.
Support: The green line and green shade represent support levels. These levels are where the price tends to find buying interest, preventing it from falling further. Traders can consider these levels as potential buying opportunities.
Resistance: The red line and red shade represent resistance levels. These levels are where the price tends to encounter selling pressure, preventing it from rising further. Traders can consider these levels as potential selling opportunities.
Breakouts: If the price breaks above the resistance zone (red shade) convincingly, it may indicate a bullish breakout, and the price could move higher to the next resistance level. On the other hand, if the price breaks below the support zone (green shade) convincingly, it may indicate a bearish breakout, and the price could move lower to the next support level.
Keltner Channel:
The Keltner Channel is a technical indicator that uses an exponential moving average (EMA) to create an upper and lower channel around the price action. Traders can use this channel to identify potential long and short positions.
Long Position: If the price is above the upper line of the Keltner Channel, it may indicate a potential long opportunity, as it suggests the price is trading above the average range and might continue in an upward trend.
Short Position: If the price is below the lower line of the Keltner Channel, it may indicate a potential short opportunity, as it suggests the price is trading below the average range and might continue in a downward trend.
Disclosure: I am not SEBI registered. I just wanted to let you know that the information provided here is for learning purposes only. Please consult your financial advisor before making any decisions. Tweets neither advice nor endorsement.

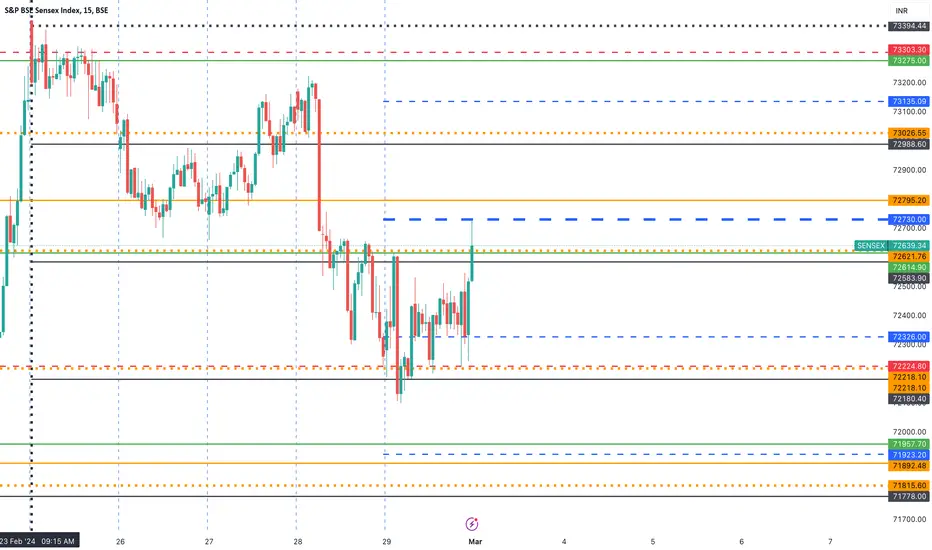
SENSEX- Intraday Levels - 1st March 2024If SENSEX Sustain above 72730 or 72795 then 72988 to 73026 strong level then 73135 then 73275 to 73303 then 73394 we can expect more bullish movement above this
if SENSEX Sustain Below 72583 then 72326 then 72224 to 72180 strong level then 71957 to 71923 or 71892 to then 71815 to 71778 below this we can expect more bearish movement
Consider +/- 15 points buffer points in above levels.
Please do your due diligence before trading or investment.
**Disclaimer -
I am not a SEBI registered analyst or advisor. I does not represent or endorse the accuracy or reliability of any information, conversation, or content. Stock trading is inherently risky and the users agree to assume complete and full responsibility for the outcomes of all trading decisions that they make, including but not limited to loss of capital. None of these communications should be construed as an offer to buy or sell securities, nor advice to do so. The users understands and acknowledges that there is a very high risk involved in trading securities. By using this information, the user agrees that use of this information is entirely at their own risk.
Thank you.