Sensex off to 45000 by March 2021Bears must have been happy to see the rising wedge formation all this while when the V shaped recovery resumed to claim the former top but cooled off at ~39500. The rising wedge formation did validate for a while and shared the target of ~34500 from a 'measured move' perspective. Note the divergence from the RSI while it tends to form a falling wedge which is the only caution this time.
But hey, bulls are back. So I suspect the possible H&S pattern as a trend 'reversal indicator' in formation turning sentiment from bearish/neutral to bullish and once the right shoulder forms completely (give or take 3 months) we would enter to claim new ATH most likely before April 2021.
45000 Sensex is incoming!
SENSEX trade ideas

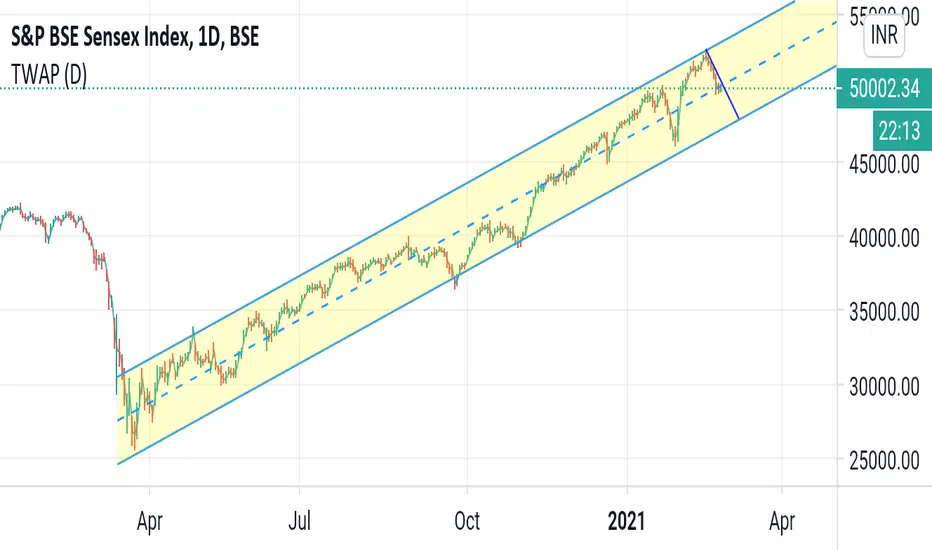
SENSEX is Falling 01/02/2021as we can see
we have bearish Divergence with MACD Signal and MACD Histogram and it is at the end of a bullish trend which is happening post corona Pandemic and it can be interpreted as trend reversal and Distribution time
now it can be the time for some correction and retraces
we have analyzed the daily Timeframe and used Price Action Strategy to find the accumulation zones
these areas are also having confluences with Fibonacci retracement levels which are good areas to target or enter
we may have a small bullish Spike but the overall scenario is bearish from now onwards


bse sensexHI THERE
AT THIS MOMENT MARKET IS A GOOD BULLISH TRAND. BUT MARKET NEED TO SOME CORRECTION FOR STRANGHT. AND GRAB SOME LEQUIDITY. MY THINK IS MARKET IS NOW A RESISTENCE AREA AND GOING TO TEST SOME PREVIOUS AREA. AS I MANTION MY AREA IS 52554-52574 IS A MAJOR RESISTENCE AREA

Sensex Long term trading ideasSensex looks good for long term basis bullish above 50330 and support on longer Time frame 47000
"BSE:SENSEX" - "SELL" signal 15 min (Solved Signal 1)-SELL signal generated by "Solved Signal 1(SS1)" in 15 min Chart of "BSE:SENSEX" Index
- "BSE:SENSEX" 15 min chart
- Indicator used "Solved Signal 1(SS1)"
- Solved Signal 1 generates SELL signal(by default: text:- SS1,color=red,shape=triangledown)
on 15 min chart of "BSE:SENSEX"' .It means "BSE:SENSEX" can go down.
-Solved Signal 1 "BSE:SENSEX" Price data for Solving the Market(See description of Indicator).
-Like and Comment.
-Thankyou
BSE:SENSEX NSE:NIFTY NSE:BANKNIFTY NSE:NIFTY


bse sensexthis is a clear view on BSE. at this moment we don't see any shorting opportunity. its going up and more my next target area is 50776.if reach this level. then next we see the price action on this particular area. next is next see you later. stay with me


Short SenSexDate: 11/30
Stock: Sensex
R:R 1.5
Position: Short
Time period: 1day
Entry Price: 44175
Exit Target: 42146
Reasons for Shorting: Contradiction on Price and RSI.
- Lower lowes on RSI
MACD crossing Signal


SENSEXlet me know in the comment section below if you have any questions,
the entry will be taken only if all rules of the strategies will be satisfied.


