SJVN 's Key level for Swing .This is the 4 hour chart of SJVN.
SJVN is forming a broadening pattern with support near at 90 range.
SJVN is forming a descending broadening pattern within a larger ascending broadening structure with support at near 91 range.
If this level is sustain then ,we may see higher prices in SJVN.
SJVN trade ideas

SJVNSEBI-Disclosure for Stock Analysis
For Informational Purposes Only: The analysis provided above is for educational and informational purposes only and is based on the technical interpretation of the supplied stock chart. It should not be construed as financial advice, investment advice, or a recommendation to buy, sell, or hold any security.
Not a Financial Advisor: I am an AI assistant and not a registered or qualified financial advisor, investment advisor, or stockbroker. The information presented is generated without considering your individual financial situation, risk tolerance, or investment objectives.
Risk of Loss: Trading and investing in financial markets, including equities, carry a significant risk of loss. The value of stocks can fluctuate, and you may lose part or all of your investment. Past performance is not indicative of future results.
Consult a Professional: Before making any investment decisions, you should conduct your own thorough research and/or consult with a qualified financial professional to assess your personal circumstances and the suitability of any investment.
Information Accuracy: While this analysis is based on the data visible in the chart, it does not account for all possible market variables, including fundamental factors (like company earnings, debt, management) or macroeconomic events (like interest rate changes, government policies) that can impact the stock's price.
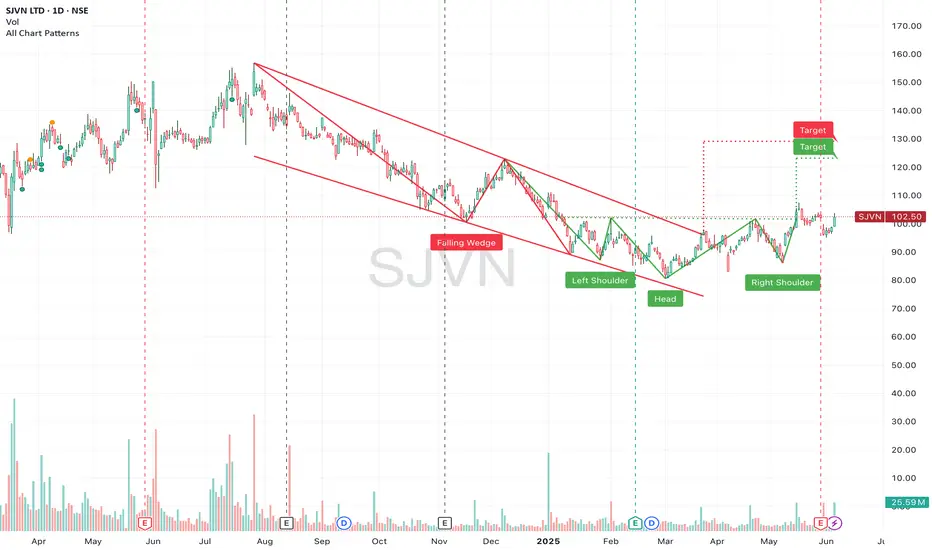
Inverse head and shoulderVery nice example of inverse head and shoulder on a perfect place in a bottom , Chances This stock will go Towards head and shoulder destination which is down peak to the peak

in sjvn we can show strong support of 103 and nowits proper showSo in sjvn target is 150 + and its bottom show clear 103 and 100 so u can partial buy on this level

Technical Analysis of SJVN Ltd (Bullish Momentum)Technical Analysis of SJVN Ltd
Overview of the Stock:- The chart shows the 1-hour timeframe of SJVN Ltd (SJVN) on the National Stock Exchange (NSE) of India. The analysis is focused on identifying potential trading opportunities based on technical indicators and price action.
Key Observations - Price Action:
Pullback or Reversal Zone: The price is currently near a potential pullback or reversal zone between 116.10 and 124.78. This zone might offer a buying opportunity if the price shows signs of a reversal.
Safe Buy Above 134.42: The chart indicates that a safe buy level is above 134.42. If the price breaks above this level, it could signal a bullish trend.
Technical Indicators:
Relative Strength Index (RSI): The RSI is currently below 50, suggesting that the stock is oversold. This could be a positive sign for potential buyers.
Moving Average (EMA): The 200-hour Exponential Moving Average (EMA) is above the current price, indicating a bearish trend. However, if the price breaks above the EMA, it could signal a bullish reversal.
Trading Strategy - Based on the analysis, a potential trading strategy could be:
Buy More in the Pullback Zone: If the price retraces to the pullback or reversal zone (116.10-124.78), consider buying more shares to accumulate an average position.
Stop Loss: Place a stop loss below the lowest price in the recent pullback or reversal zone to limit potential losses.
Take Profit: Consider taking profits at the safe buy level (134.42) or at a higher resistance level, depending on your risk tolerance and investment horizon.
Additional Considerations
News and Fundamental Analysis: While this analysis is based on technical indicators, it's essential to consider news and fundamental factors that could impact SJVN's stock price.
Risk Management: Always practice proper risk management techniques, such as diversifying your portfolio and setting realistic stop-loss levels.
Remember: Technical analysis is a tool to help identify potential trading opportunities, but it does not guarantee profits. Always conduct thorough research and consider your own risk tolerance before making investment decisions.
Disclaimer:- This analysis is based on the provided chart and is for informational purposes only. It does not constitute financial advice. Always consult with a financial advisor before making investment decisions. Do your own research before buying this stock because I am not SEBI registered person and this is just for educational purposes. We are not responsible for your loss.
Thanks for your support as always

sjvn chart analysissjvn chart analysis on daily chart analysis. Please share your valuable feedback.

SJVN- Analysis
Entry around CMP to 111 or above 137
Stop loss levels Closing below - 90 or 80
Expected Major Targets -203 to 209 then we can target for 295
Minor Targets - 181 , 231, 255 and 315
Please do your due diligence before trading or investment.
*Comment or message me if you wish to see my analysis for any stocks.
**Disclaimer -
I am not a SEBI registered analyst or advisor. I does not represent or endorse the accuracy or reliability of any information, conversation, or content. Stock trading is inherently risky and the users agree to assume complete and full responsibility for the outcomes of all trading decisions that they make, including but not limited to loss of capital. None of these communications should be construed as an offer to buy or sell securities, nor advice to do so. The users understands and acknowledges that there is a very high risk involved in trading securities. By using this information, the user agrees that use of this information is entirely at their own risk.
Thank you.

SJVN TARGET 170 STOP LOSS 130Script is very good retracement from the weekly uptrend channel support line with day bullish with good volume increase. Highly possible to reach the first target of 152 and second 170

SJVN (Daily)SJVN LTD (Daily)
CMP - 144
Cosolidation resistance breakout
Breakout with volume
Retesting breakout resiatance
Can see ATH again if sustains breakout
Volume Spurt
Disclaimer: No buy sell recommendation. For educational purpose only.


SJVN tgt 10%SJVN - ALL RENEWABLE ENERGY STOCKS ARE RECOVERING -
Breakout above 134 - can hit 150 in near term.

SJVN LONG !Expecting good Momentum .
Consolidation done .
Coming out of the Range.
Good for Short term.
Target 170, 220.
Do Like ,Comment , Follow for regular Updates...
Disclaimer : This is not a Buy or Sell recommendation. I am not SEBI Registered. Please consult your financial advisor before making any investments . This is for Educational purpose only.


Consolidation Breakout - SJVN📊 Script: SJVN
📊 Sector: Power Generation & Distribution
📊 Industry: Power Generation And Supply
Key highlights: 💡⚡
📈 Script is giving breakout of consolidation zone as highlighted into chart.
📈 Already Crossover in MACD & Double Moving Averages.
⏱️ C.M.P 📑💰- 132
🟢 Target 🎯🏆 - 142
⚠️ Stoploss ☠️🚫 - 127
⚠️ Important: Always maintain your Risk & Reward Ratio.
✅Like and follow to never miss a new idea!✅
Disclaimer: I am not SEBI Registered Advisor. My posts are purely for training and educational purposes.
Eat🍜 Sleep😴 TradingView📈 Repeat 🔁
Happy learning with trading. Cheers!🥂

Breakout happend in SJVNBreakout happend in this stock with rising 40 week MA and rs indicator is also showing strength.
Keep your risk and reward ratio according to your own preferances.
This is for educational purpose, do your own research before investing.


SJVNStock in consolidation
Good for long-term and has a good potential.
Invest doing your due diligence

SJVN Ltd - An Opportunity to Buy as CMP or Wait for Safe BuyAs per previous chart history and pattern, an opportunity to buy SJVN Ltd is seen on the chart. This is based on technical analysis and previous chart history.
Do your own research before buying this stock as I am not SEBI registered person and this is my own opinion and analysis about the stock.
All points mentioned on the chart. Go through the chart and monitor for proper entry in this stock. You can buy at CMP or wait for pullback or reversal or your can buy above Safe buying point as mentioned on the chart.
Thanks for your support as always

SJVN - Looks good for 15% UpmoveOne may consider buying at demand levels marked, best buy at 91 and below demand levels or at CMP based on risk appetite.
Expecting target 110.


SJVN-Multi- year breakoutSJVN Limited (SJVN) is an Indian state-owned power company headquartered in New Delhi. It was incorporated in 2006 as a joint venture between the Government of India and the Government of Himachal Pradesh. SJVN's primary business is the generation and sale of electricity. It has a portfolio of power projects, including thermal, hydro, wind, and solar power plants. SJVN also operates a transmission line network.
A multi-year breakout is often a sign that the stock is entering a new bullish trend and could see significant price appreciation in the future.

SJVN bullish Cup Handle pattern SJVN has formed a cup handle pattern
you can go for long position
just for educational purpose
Happy Trading
