STAR Health: Building Strength Quietly?STAR Health has shown a clear Wave (2) bottom and now appears to be in early stages of Wave (3). Price recently bounced from the 50–61.8% Fibonacci zone, retesting volume-supported levels around ₹425–₹430.
If this impulse unfolds cleanly, bullish targets lie ahead:
• Short-term: 506
• Extension: 562 (1.618 Fib)
Volume support + structure suggests institutional interest is active.
Fundamentals:
• Market Cap: ~₹25,000 Cr
• ROE: ~20%, Solvency Ratio: ~2.1x
• P/E: ~45x | P/B: ~9.2x (Premium valuation due to sector position)
• Promoter Holding: 58.28% (No pledging)
• Strong DII & FII interest, rising institutional exposure
STAR is India’s leading standalone health insurer with over 8 lakh agents, expanding presence, and structural demand tailwinds post-COVID. Long-term fundamentals support technical recovery.
Keep on radar: Break and close above 440–₹445 can ignite further momentum.
NOTE: This post is for educational purposes only not a buy/sell recommendation.
STARHEALTH trade ideas

$starhealth& al inshola,
33% in a month not bad was bound to reverse since the numbers are good for this ..
expected the rejection here at the bold thick white line
rsi topped up curling down so expect it to retrace then go for resistance 2 more times before going mental August onwards maybe not.. but hey time for nifty to range and money to flow to mid and small caps imho

$starhealthandinsurancelooks like the entire nifty is setting up for q3 fireworks
not sure how the summer will play out but for now i recon this reversal is confirmed with the impulsive move from the lows after seller exhaustion
am in from above but have patience not sure how far this runs but good high hopes from it
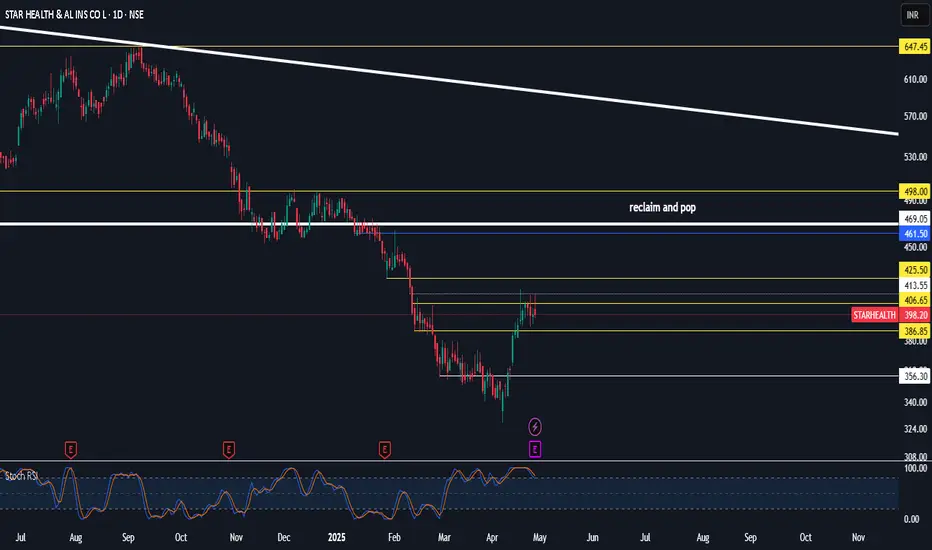
$starhealth&alliedinsurancedeviation below range low
bleeding for almost 3 years
rsi is about to get above the mid band the price should follow
resulting in a reclaim of previous range low and a run to range high where am leaning toward a break out to the blue line at least
not in this currently just pursuing for the morning


Star Health: Trendline Breakout Signals Bullish ReversalStar Health is showing promising signs for long-term holding.
The chart shows a clear downward sloping trendline that has been respected for a considerable period. Recently, the price has broken above this trendline, indicating potential trend reversal from bearish to bullish.
The immediate swing high at ₹675 is a crucial level to watch. This level may act as resistance in the short term.
If the price manages to break above this swing high, it could open the door for a move towards the supply zone. However, if the price faces rejection at this level, a pullback could occur.
The chart suggests a potential scenario where the price could retrace after testing the swing high at ₹675. This retracement could provide a good opportunity for accumulation if the price finds support at lower levels, such as the ₹560-580 zone.
There is a significant increase in volume during the breakout, which adds strength to the bullish case.
Key support levels to watch include the ₹560-580 zone, where the price previously found support after the breakout
There is a marked supply zone between approximately ₹770 and ₹820. where sellers have previously stepped in, leading to price declines. If the price approaches this zone again, it may face significant resistance.
Consider entering a position if the price holds above ₹675 or on a pullback to the ₹560-580 zone. Accumulating during pullbacks with proper risk management could be a prudent strategy.
Be cautious of potential reversals or rejections at the ₹675 swing high or within the supply zone.
This is not a Buy Recommendation, just an idea.
Please give a boost and comment if you like my analysis and feel free to share with others.
Disclaimer: I am not a Sebi Registered Analyst, and the views expressed are of my own and for educational purpose only, Make sure you consult your financial advisor before investing, as I wont be Responsible for any losses incurred.

STARHEALTHStar health has breakout major trend line and resistance Target are mention in the chart and this is only for educational purpose

STARHEALTHStar health has breakout major trend line and resistance Target are mention in the chart and this is only for educational purpose

STAR HEALTH READY TO ROCKSTAR HEALTH can double from here with in few years. Sl below the trend line.
Chart is self explanatory. Please follow the price action & take the trade as per your appetite.
The information provided here is only for educational purpose. The information provided here is not intended to be any kind of financial advice, investment advice, and trading advice. Investment in stock market is very risky and trading stocks, options and other securities involve risk. The risk of loss in stock market can be substantial. Moreover, I am not a SEBI registered analyst, so before taking any decision or before investing in any Share consult your financial advisor and also do your analysis and research.
Request your support and engagement by liking and commenting & follow to provide encouragement.

swing pick - buy at zonethis zone marked is potential reversal zone . expecting reversal from that zone.buyers can look for buying confirmation inside the zone.
-- for target , mark fib retracement on C to latest swing low and keep 0.5 fib value as tgt.
-- sl is candle close below zone
-- if candle closed below this zone , this pattern is invalid. ignore this pick

Educational view_Star HealthBreakout possible ? during Feb-Aug, 2024
Descending triangular pattern
Strong support at 518
Only an educational view

Star health viewStar health view
Waiting to sustain above 550 for more upside
Follow strict risk reward and stop loss if you follow the level
Charts for Educational purposes only
Thanks,
Vichithra

Star Health could see Strong Upside potential.In the event of a market downturn below 508, with a stop-loss set at 480, potential targets could be 739, 812, and 907. Prior to initiating any trades for educational purposes, it is advisable to consult with a financial advisor.

Breakout SoonStar Health & Allied Insurance Stock Weekly Chart Analysis.
Key Trend line to follow :-
1. Follow Red Color Trend Line Range Range for trend
Reversal.
2. Follow Green Color Trend Line Range for support.
Important ---- Keep Track for the breakout from Red Color Long Term Trend line Resistance Range. Breakout from this trend line might show possible trend reversal.
If Broken from TRR
1. First Level of Resistance is Rs. 666 to 677
2. Second Level of Resistance is Rs. 750 to 760
3. Third Level of Resistance is Rs. 830 to 850
Note :- Post is for Educational Purpose and not buy/sell recommendation. I have been wrong in past and i will be wrong in future as well, so please do your own research before investing.
If you like my efforts, Please feel free to like, Re-tweet and Follow.


Star health Beautiful rsi divergence and stock raising from support. Risky players can go long with sl according to their comfort. Targets plotted

STARHEALTHStock Clearly in downtrend
All moving averages below the price
MACD Bearish crossover
RSI also indicate Bearish
Chart setup favour in short.
Disclaimer This is my personal view for education purpose only
No Buy sell recommendations.

STARHEALTH : Going LongFrom the share holding pattern itself one thing is clear and that is the strong hands of institutions are involving in the stock from the last quarter of 2022 onwards while the weak hands of retailers are moving out of it.
In a country like India where a large majority of people are still unaware of the importance of health insurance, there is high growth prospects for a company like Star Health. The institutions are well aware of this and that is exactly why they are being involved in the stock at these valuations.
So when compared to the price at which institutions started accumulating, I'm at a better price point from a valuation perspective. So I'll even consider adding more on to the position if price falls further down to the next inflection point and sum up the total holding to 2.5% of the capital.
As of now, I took a position for about 1.25% of the capital.

STAR HEALTHAs u all know my favrate pattern Double bottom. Star health is also Confirming same pattern.
analysis volume in last rally volume was very good.
Also doing gud consolidation in this price range on ( See on weekly Time Frame).
if stock crosses upper range of this consolidation then it may gud upper side.
SL 572.
SWING TRADE AT LEAST FOR 6 MONTHS.
it has gud potential upside target. follow strick sl & proper risk reward ratio. this is the only holy grail in the market.

Star Health and Allied Insurance Company Ltd. Chart is self explanatory. Please follow the price action & take the trade as per your appetite.
The information provided here is only for educational purpose. The information provided here is not intended to be any kind of financial advice, investment advice, and trading advice. Investment in stock market is very risky and trading stocks, options and other securities involve risk. The risk of loss in stock market can be substantial. Moreover, I am not a SEBI registered analyst, so before taking any decision or before investing in any Share consult your financial advisor and also do your analysis and research.
Request your support and engagement by liking and commenting & follow to provide encouragement.

STAR HEALTH 1w time frame buy @ cmp target 580, 590, 600, 608 STAR HEALTH 1w time frame buy @ cmp target 580, 590, 600, 608
risk reward 1.79
ascending triangle
sl 501

StarhealthStarhealth looks good to long at 560 wirh stop loss of 500 for the target of 620 & 680 & 740

STAR HEALTHSTAR HEALTH will it be a STAR in 2023 or will it show a classic Clearance and Thrust on the Low side
