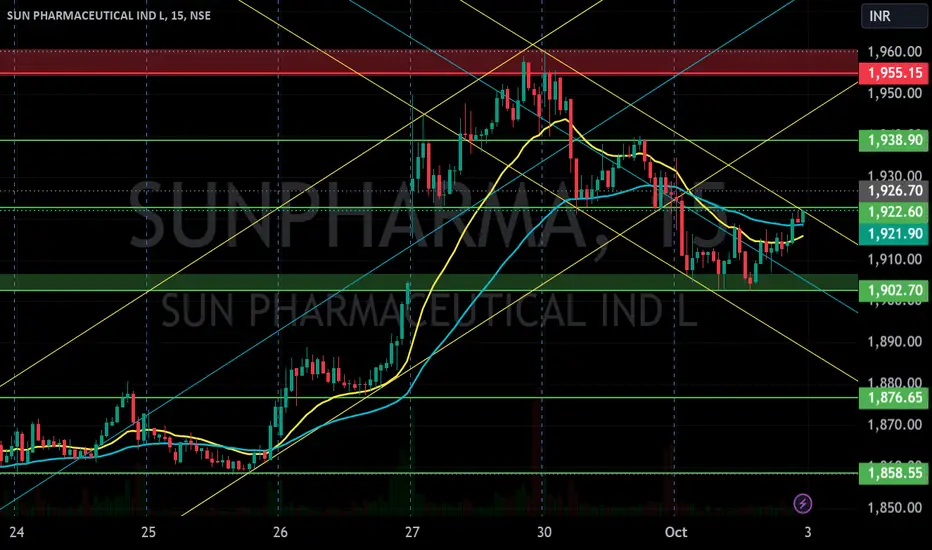
Sunpharma I'm not a SEBI REGISTERED ANYLISIS
just for learning purpose
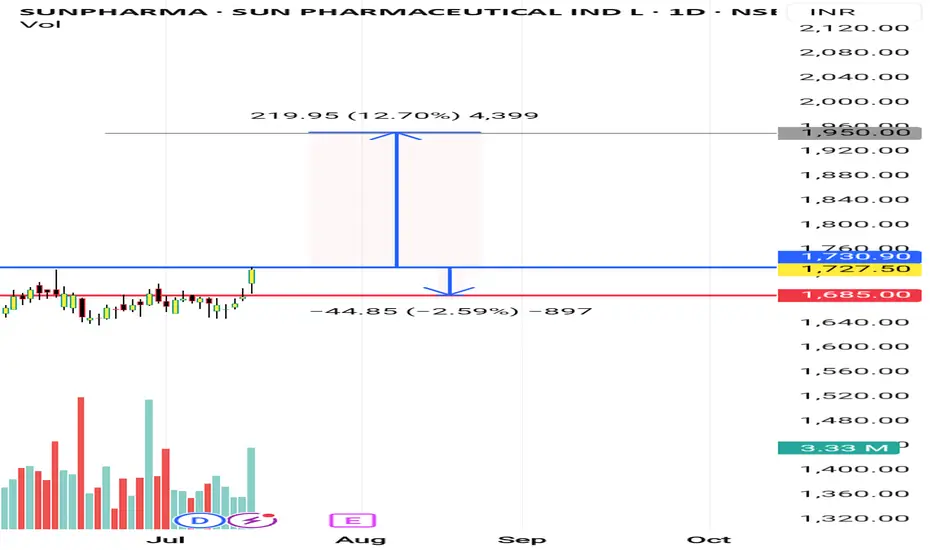
above the blue line close in D chart candle i will buy and put strictly SL to below red line...once candle close below Red line in D chart...i will close the Trade...
Note: 1
Breakout candle should close time 6 or below 6 points I will buy same day or I will wait for the blue line price to re-trace)
Note:2
If previous volume is buyers(for ex- 10k) Breakout candle volume should be low in present day with buyers volume(below 10k for ex- 9k like this)
target check the chart
WAIT FOR ENTRY......then after
WAIT FOR TARGET...... or
WAIT FOR STOPLOSS
educational purpose only
oits simple ORB WITH VOLUME BREAKOUT STRATEGY...with small condition apply for selecting the stocks
owt not response for your profit and loss
SUNPHARMA trade ideas
Review and pln for 16th July 2025Nifty future and banknifty future analysis and intraday plan.
This video is for information/education purpose only. you are 100% responsible for any actions you take by reading/viewing this post.
please consult your financial advisor before taking any action.
----Vinaykumar hiremath, CMT

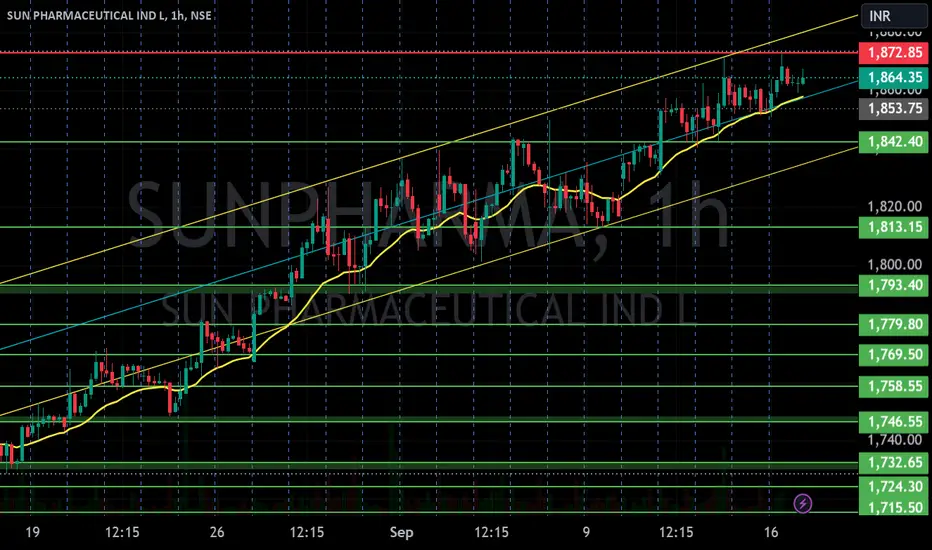
a Clear indication of breakout for Sun Pharma keep it on trackI have jotted down the Gann Box of 90 days. I have place Gann Box together to understand the trend line of Sun Pharma

Review and plan for 23rd May 2025 Nifty future and banknifty future analysis and intraday plan.
Quarterly results
This video is for information/education purpose only. you are 100% responsible for any actions you take by reading/viewing this post.
please consult your financial advisor before taking any action.
----Vinaykumar hiremath, CMT

SUN PHARMA | Inverted Head & Shoulders BreakoutSun Pharma has completed an Inverted Head and Shoulders pattern on the daily chart, signaling a potential bullish reversal.
📈 Entry: Buy above ₹1800 (breakout confirmation)
📉 Stop Loss: ₹1722 (below right shoulder support)
🎯 Targets (based on Fibonacci extensions & previous resistance zones):
• ₹1837.30
• ₹1875.35
• ₹1914.20
• ₹1953.90
• ₹1994.35
• ₹2034.55
The neckline breakout has occurred with decent volume, reinforcing the validity of the setup. As always, risk management is key — trailing stop loss recommended as price moves in favor.
💡 Disclaimer: This is for educational purposes only. Do your own research before making any trading decisions.

#SUNPHARMACEUTICAL Supply ZoneShort selling is a trading strategy used by investors to profit from the decline in the price of a stock or other financial asset. Here’s how it works:
Borrowing Shares: An investor borrows shares of a stock they believe will decrease in value, typically from a broker.
Selling the Shares: The borrowed shares are sold in the market at the current price.
Waiting for Price Drop: The investor waits for the stock price to fall.
Buying Back Shares: Once the price drops, the investor buys back the same number of shares at the lower price.
Returning Shares and Profiting: The shares are returned to the broker, and the investor pockets the difference between the selling price and the buying price as profit.

SUN PHARMA S/R for 27/1/25Support and Resistance Levels:
Support Levels: These are price points (green line/shade) where a downward trend may be halted due to a concentration of buying interest. Imagine them as a safety net where buyers step in, preventing further decline.
Resistance Levels: Conversely, resistance levels (red line/shade) are where upward trends might stall due to increased selling interest. They act like a ceiling where sellers come in to push prices down.
Breakouts:
Bullish Breakout: When the price moves above resistance, it often indicates strong buying interest and the potential for a continued uptrend. Traders may view this as a signal to buy or hold.
Bearish Breakout: When the price falls below support, it can signal strong selling interest and the potential for a continued downtrend. Traders might see this as a cue to sell or avoid buying.
20 EMA (Exponential Moving Average):
Above 20 EMA(50 EMA): If the stock price is above the 20 EMA, it suggests a potential uptrend or bullish momentum.
Below 20 EMA: If the stock price is below the 20 EMA, it indicates a potential downtrend or bearish momentum.
Trendline: A trendline is a straight line drawn on a chart to represent the general direction of a data point set.
Uptrend Line: Drawn by connecting the lows in an upward trend. Indicates that the price is moving higher over time. Acts as a support level, where prices tend to bounce upward.
Downtrend Line: Drawn by connecting the highs in a downward trend. Indicates that the price is moving lower over time. It acts as a resistance level, where prices tend to drop.
Disclaimer:
I am not a SEBI registered. The information provided here is for learning purposes only and should not be interpreted as financial advice. Consider the broader market context and consult with a qualified financial advisor before making investment decisions.

SUNPHARMA BEST BUY AROUND 1490SUN PHARMA Is in uptrend but it will see correction upto 1490 and its the best buy level of this beautiful scrip, so wait for that and catch it for long term

SUN PHARMA S/R for 20/1/25Support and Resistance Levels:
Support Levels: These are price points (green line/shade) where a downward trend may be halted due to a concentration of buying interest. Imagine them as a safety net where buyers step in, preventing further decline.
Resistance Levels: Conversely, resistance levels (red line/shade) are where upward trends might stall due to increased selling interest. They act like a ceiling where sellers come in to push prices down.
Breakouts:
Bullish Breakout: When the price moves above resistance, it often indicates strong buying interest and the potential for a continued uptrend. Traders may view this as a signal to buy or hold.
Bearish Breakout: When the price falls below support, it can signal strong selling interest and the potential for a continued downtrend. Traders might see this as a cue to sell or avoid buying.
MA Ribbon (EMA 20, EMA 50, EMA 100, EMA 200) :
Above EMA: If the stock price is above the EMA, it suggests a potential uptrend or bullish momentum.
Below EMA: If the stock price is below the EMA, it indicates a potential downtrend or bearish momentum.
Trendline: A trendline is a straight line drawn on a chart to represent the general direction of a data point set.
Uptrend Line: Drawn by connecting the lows in an upward trend. Indicates that the price is moving higher over time. Acts as a support level, where prices tend to bounce upward.
Downtrend Line: Drawn by connecting the highs in a downward trend. Indicates that the price is moving lower over time. It acts as a resistance level, where prices tend to drop.
Disclaimer:
I am not a SEBI registered. The information provided here is for learning purposes only and should not be interpreted as financial advice. Consider the broader market context and consult with a qualified financial advisor before making investment decisions.
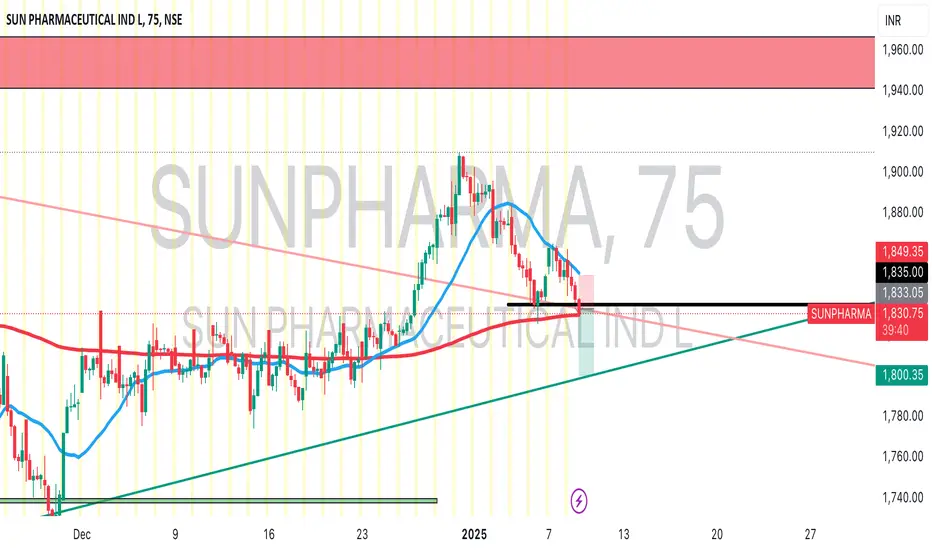
SUNPHARMA | STBT | SHORTSUNPHARMA is clearly unable to sustain above the Monthly Pivot and has gotten rejected strongly.
Weekly Pivot also has not been able to sustain.
The Bulls are clearly trapped and hence, a short STBT type trade can be initiated for a target to 1800 level which is also a long term trend line.
SUN PHARMA S/R for 7/1/25Support and Resistance Levels:
Support Levels: These are price points (green line/shade) where a downward trend may be halted due to a concentration of buying interest. Imagine them as a safety net where buyers step in, preventing further decline.
Resistance Levels: Conversely, resistance levels (red line/shade) are where upward trends might stall due to increased selling interest. They act like a ceiling where sellers come in to push prices down.
Breakouts:
Bullish Breakout: When the price moves above resistance, it often indicates strong buying interest and the potential for a continued uptrend. Traders may view this as a signal to buy or hold.
Bearish Breakout: When the price falls below support, it can signal strong selling interest and the potential for a continued downtrend. Traders might see this as a cue to sell or avoid buying.
MA Ribbon (EMA 20, EMA 50, EMA 100, EMA 200) :
Above EMA: If the stock price is above the EMA, it suggests a potential uptrend or bullish momentum.
Below EMA: If the stock price is below the EMA, it indicates a potential downtrend or bearish momentum.
Trendline: A trendline is a straight line drawn on a chart to represent the general direction of a data point set.
Uptrend Line: Drawn by connecting the lows in an upward trend. Indicates that the price is moving higher over time. Acts as a support level, where prices tend to bounce upward.
Downtrend Line: Drawn by connecting the highs in a downward trend. Indicates that the price is moving lower over time. It acts as a resistance level, where prices tend to drop.
Disclaimer:
I am not a SEBI registered. The information provided here is for learning purposes only and should not be interpreted as financial advice. Consider the broader market context and consult with a qualified financial advisor before making investment decisions.

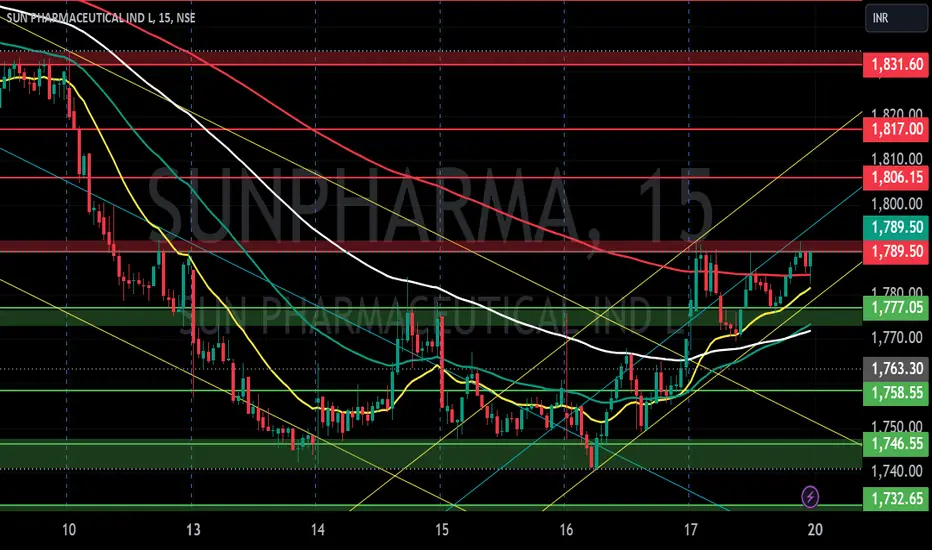
SUN PHARMACEUTICAL LONG ENTRYSun Pharmaceutical's stock is currently trading in a flag pattern. It has taken support twice on the same trend line, and this is the third time. Similarly, the resistance is very strong. Based on the trend line (TL) support, an entry can be considered, with a stop loss placed below the TL. A long-side entry can be planned accordingly.
Whether it’s F&O or equity, analyze thoroughly before entering. This is purely for educational purposes.

Sun Pharma | Long | BTSTSun Pharma is showing good bullish price action and is holding strongly above the Monthly & Weekly Pivots.
Long position can be built for a quick long target to 1860 level.
Beware that there is a trend line resistance at that level. So ensure that profit booking is done at that level.

Sun Pharma | Short | SwingPharma sector is having a good selling pressure now and this is evident in top Pharma heavyweights like Sun Pharma, Divis etc.
There is a clear rejection of pivots - Weekly & Daily and you can see the Lower highs being formed which clearly shows that buyers are certainly not in control.
I have taken short positions for a Monthly target of around 1740 levels.
Let's see...

#sun pharma for a month As we can see a clear picture of bull flag pattan second time it is very good time for buying this stock for 1 to 2 months for the profit of 25%
After brake out of the channel we will take trade
With a small stop loss

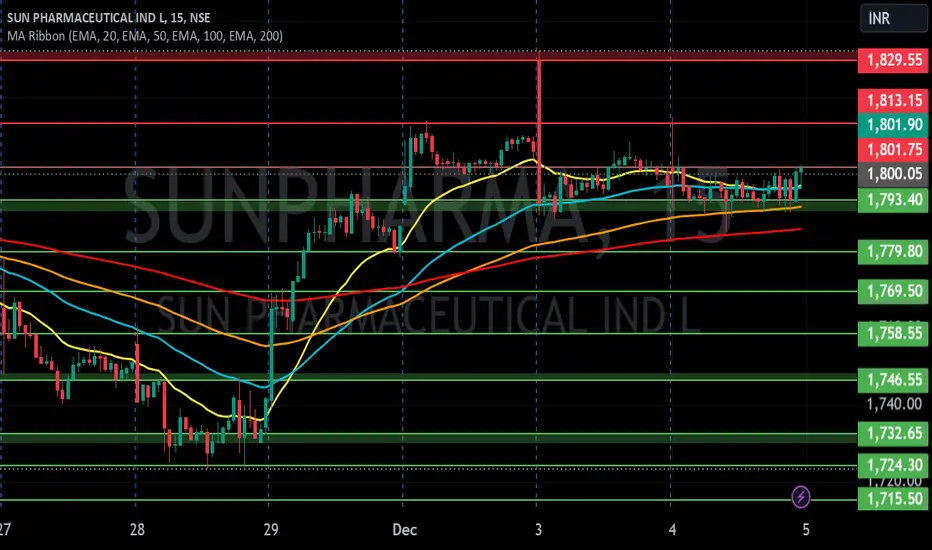
SUN PHARMA S/R 5/12/24Support and Resistance Levels:
Support Levels: These are price points (green line/shade) where a downward trend may be halted due to a concentration of buying interest. Imagine them as a safety net where buyers step in, preventing further decline.
Resistance Levels: Conversely, resistance levels (red line/shade) are where upward trends might stall due to increased selling interest. They act like a ceiling where sellers come in to push prices down.
Breakouts:
Bullish Breakout: When the price moves above resistance, it often indicates strong buying interest and the potential for a continued uptrend. Traders may view this as a signal to buy or hold.
Bearish Breakout: When the price falls below support, it can signal strong selling interest and the potential for a continued downtrend. Traders might see this as a cue to sell or avoid buying.
MA Ribbon (EMA 20, EMA 50, EMA 100, EMA 200) :
Above EMA: If the stock price is above the EMA, it suggests a potential uptrend or bullish momentum.
Below EMA: If the stock price is below the EMA, it indicates a potential downtrend or bearish momentum.
Trendline: A trendline is a straight line drawn on a chart to represent the general direction of a data point set.
Uptrend Line: Drawn by connecting the lows in an upward trend. Indicates that the price is moving higher over time. Acts as a support level, where prices tend to bounce upward.
Downtrend Line: Drawn by connecting the highs in a downward trend. Indicates that the price is moving lower over time. It acts as a resistance level, where prices tend to drop.
Disclaimer:
I am not a SEBI registered. The information provided here is for learning purposes only and should not be interpreted as financial advice. Consider the broader market context and consult with a qualified financial advisor before making investment decisions.
Excellent trade for sunpharma if makes this break out. Excellent trade for sunpharma breakout. watchout. I did the same with Kotak 2-3 days before. It gave good results on intraday on that day. So watchout for sunpharma CE dont short even if it going down. Wait for the opportunity on tomrw nd coming days. Please dont dont short. Take care. Again I am just technical analyst no recommendations. so pls check and trade as per ur analysis. Take care. Jai hind.

Sunpharma investmentcmp: 1810 on Nov 2024
qnty: 146
total investment: 87k/-
from 2018 to 2024, in 6 years,
Return is +200%
unrealised profit= 1.8 lacs/-

Sun Pharma - Long Setup (Swing Trade)Sun Pharma has confirmed a breakout above the entry zone, presenting a swing trade opportunity. Here’s the trade setup:
Entry Price: 1836.95 (Confirmed after the 15-minute candle broke above the entry zone at 1833)
Target: 1978.8
Stop Loss: 1760.10 (Triggered if a daily candle closes below this level)
With the entry price confirmed at 1836.95 , this setup offers a favorable risk-to-reward ratio. The target is set at 1978.8 , with a well-defined stop loss at 1760.10 to manage risk.
Disclaimer: This post is for educational purposes only and is not financial advice. Always manage your risk and trade responsibly.

SUN PHARMA S/R Support and Resistance Levels:
Support Levels: These are price points (green line/shade) where a downward trend may be halted due to a concentration of buying interest. Imagine them as a safety net where buyers step in, preventing further decline.
Resistance Levels: Conversely, resistance levels (red line/shade) are where upward trends might stall due to increased selling interest. They act like a ceiling where sellers come in to push prices down.
Breakouts:
Bullish Breakout: When the price moves above resistance, it often indicates strong buying interest and the potential for a continued uptrend. Traders may view this as a signal to buy or hold.
Bearish Breakout: When the price falls below support, it can signal strong selling interest and the potential for a continued downtrend. Traders might see this as a cue to sell or avoid buying.
20 EMA (Exponential Moving Average):
Above 20 EMA(50 EMA): If the stock price is above the 20 EMA, it suggests a potential uptrend or bullish momentum.
Below 20 EMA: If the stock price is below the 20 EMA, it indicates a potential downtrend or bearish momentum.
Trendline: A trendline is a straight line drawn on a chart to represent the general direction of a data point set.
Uptrend Line: Drawn by connecting the lows in an upward trend. Indicates that the price is moving higher over time. Acts as a support level, where prices tend to bounce upward.
Downtrend Line: Drawn by connecting the highs in a downward trend. Indicates that the price is moving lower over time. It acts as a resistance level, where prices tend to drop.
RSI: RSI readings greater than the 70 level are overbought territory, and RSI readings lower than the 30 level are considered oversold territory.
Combining RSI with Support and Resistance:
Support Level: This is a price level where a stock tends to find buying interest, preventing it from falling further. If RSI is showing an oversold condition (below 30) and the price is near or at a strong support level, it could be a good buy signal.
Resistance Level: This is a price level where a stock tends to find selling interest, preventing it from rising further. If RSI is showing an overbought condition (above 70) and the price is near or at a strong resistance level, it could be a signal to sell or short the asset.
Disclaimer:
I am not a SEBI registered. The information provided here is for learning purposes only and should not be interpreted as financial advice. Consider the broader market context and consult with a qualified financial advisor before making investment decisions.
sun pharma 1) sun pharma breaks its trendline support
2) In option chain analysis huge put buildup in 1840 which act as a strong resistance.
3) profit level for postional opption buyer as 1740 (nearby) and sl on 1840

SUN PHARMA S/R for 17/9/24Support and Resistance Levels:
Support Levels: These are price points (green line/shade) where a downward trend may be halted due to a concentration of buying interest. Imagine them as a safety net where buyers step in, preventing further decline.
Resistance Levels: Conversely, resistance levels (red line/shade) are where upward trends might stall due to increased selling interest. They act like a ceiling where sellers come in to push prices down.
Breakouts:
Bullish Breakout: When the price moves above resistance, it often indicates strong buying interest and the potential for a continued uptrend. Traders may view this as a signal to buy or hold.
Bearish Breakout: When the price falls below support, it can signal strong selling interest and the potential for a continued downtrend. Traders might see this as a cue to sell or avoid buying.
20 EMA (Exponential Moving Average):
Above 20 EMA: If the stock price is above the 20 EMA, it suggests a potential uptrend or bullish momentum.
Below 20 EMA: If the stock price is below the 20 EMA, it indicates a potential downtrend or bearish momentum.
Trendline: A trendline is a straight line drawn on a chart to represent the general direction of a data point set.
Uptrend Line: Drawn by connecting the lows in an upward trend. Indicates that the price is moving higher over time. Acts as a support level, where prices tend to bounce upward.
Downtrend Line: Drawn by connecting the highs in a downward trend. Indicates that the price is moving lower over time. It acts as a resistance level, where prices tend to drop.
RSI: RSI readings greater than the 70 level are overbought territory, and RSI readings lower than the 30 level are considered oversold territory.
Combining RSI with Support and Resistance:
Support Level: This is a price level where a stock tends to find buying interest, preventing it from falling further. If RSI is showing an oversold condition (below 30) and the price is near or at a strong support level, it could be a good buy signal.
Resistance Level: This is a price level where a stock tends to find selling interest, preventing it from rising further. If RSI is showing an overbought condition (above 70) and the price is near or at a strong resistance level, it could be a signal to sell or short the asset.
Disclaimer:
I am not a SEBI registered. The information provided here is for learning purposes only and should not be interpreted as financial advice. Consider the broader market context and consult with a qualified financial advisor before making investment decisions.
Not much, but correction possible Sell below 1824
For 1801-1774
Trend lines etc.
Momentum fading.
It can be a very rewarding trade if we could trail.
