Multiple top Bullish Trend@sunpharmaSun pharma is on Strong Resistance @785.4 on 24 Dec. If it breaks this level upside and candle closes above 804 then Target will be @ 816 .833., 847
SUNPHARMA trade ideas

Buy above 801.8 SL 791 TGT 812Based on my trendline analysis. Please do your analysis before taking any trade.

SUNPHARMA SellSUNPHARMA Sell for day trading if PHARMA Sector also weak then we will enter in trade.

SUNPHARMA SEllSUN PHARMA SEll ford day trading IF PHARMA Sector also weak then we will enter in trade..

Sunpharma 6th Dec prediction 6th Dec prediction on the basis of Technical Analysis & price action.
This is only for educational purpose

BULLISH FORMATIONS IN SUNPHARMAOn the 1 Hour Chart of SUNPHARMA, we can see some beautiful bullish Formations of "Bullish Harami", "Hammer" as well as "Inverted Hammer" on the downside levels of the stock. Thereby, indicating a very strong bullish momentum in next trading sessions. In addition to this, the stock seems to be facing a support at the level of 746.25. As plotted and explained in the chart, we can say that it is being expected that the stock can face resistance initially at the levels of 758.45, 763.85, and 770.95. Closing Price (as on 03.12.21) : 753.35
Disclaimer: No financial information whatsoever published here, should be construed as an offer to buy or sell securities, or as advice to do so in any way whatsoever. All matter published here is purely for Educational and Information purposes only and under no circumstances should be used for making investment decisions. Viewers must consult their personal financial advisor before making any actual investment decisions, based on information published here. Any Investor or Trader taking decisions based on any information published here, does so entirely at its own risk. Investors and Traders should bear in mind that any investment in Stock Market is subject to unpredictable market-related risks.

Sun Pharmaceuticals is a sell below 740Sun Pharmaceuticals is a sell below 740.
The next support zone is near 706
and thereafter 662 zone.


Let me know, Where does it go?This is how a setup should look like, not saying it's perfect not saying I know it all, but that's what's it about you don't actually know know you always speculate and the thing is you will never know what's next in the market you just need to have view of both sides and make your setup for what looks better to you.


Sunpharma Both side trades can be taken depending upon the market situation tomorrow
please remember this chart is of lower time frame and hence i would recommend only trading it for intraday perspective
for quick gains

SUN PHARMA Bear affectedTpday SUN PHARMA can be in Bear Position So INTRRADAY TRDAERS can take this as a great OPPURTUNITY.


Trend line break out in Sun PharmaT1 was acting as a resistance now acting as support.
T2 is the trendline which price has break through it. These are the signs of bullishness. Wait for the proper confirmation to go long.
I am publishing technical analysis on tradingview for educational purpose. You can visit on my profile on tradingview app to learn and understand price action and chart analysis.

Sunpharma sell for day tradesun pharma sell for day trade if the pharma sector show weakness then we will enter in trade only for selling I will not recommend for buying
SUNPHARMA - 1HR - OUTLOOKThis equity is trading in a demand zone , obviously with a region of dynamic support .The 4-POINT pattern's fib ratios along with CORRECTIVE WAVE COUNT with a strong buyers candle will provide a bullish move as well to the level denoted.Neckline breakout will add more confirmation for defensive traders. cheers...
DISCLAIMER: This publish is just an outlook and purely meant for educational purpose.
This is not a financial advisory since trading involves huge risk,
so trade with proper money management and expert's advise..

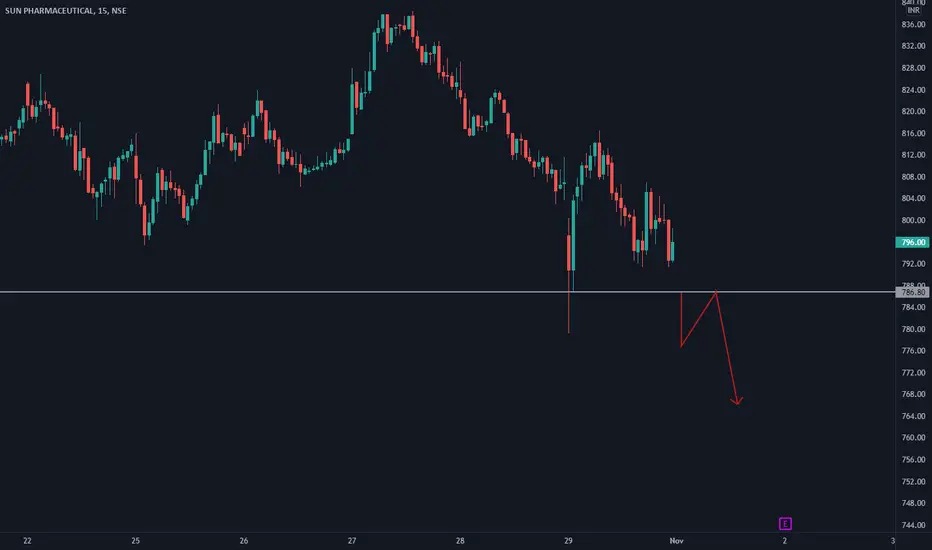
SUNPHARMA AnalysisSupport zone: 794-800
Downside Targets: 779.3, 759.55
Above 800,avoid the trade
Seems a good RR trade

SunPharma - Bullish above 910A weekly close above 910 in SunPhama can be very bullish and very strong movement can be seen


H&S followed by C&H in SUNPHARMANSE:SUNPHARMA has made inverse head and shoulders in 1H which didn't breakout yet and the right shoulder is now forming cup and handle formation. Chances are that once handle formation is complete, price may breakout on the upside. Could be a good short term swing trade. Keep an eye!

SUNPHARMA gives its breakdown of 820In daily chart SUNPHARMA has given a breakdown of 820. So its a buying indicator. In few months it may achieve 900-940 Target.
Now at 831

Sunpharma Buy SUNPAHARMA Buy if market holds and sustain at that breakout level.
BUY Above: 815
SL: 770
TGT 849

Buy Sunpharma Target 🎯 850Buy Sunpharma Target 🎯 850 because it's recently given major breakout.We can see 10% upside .
