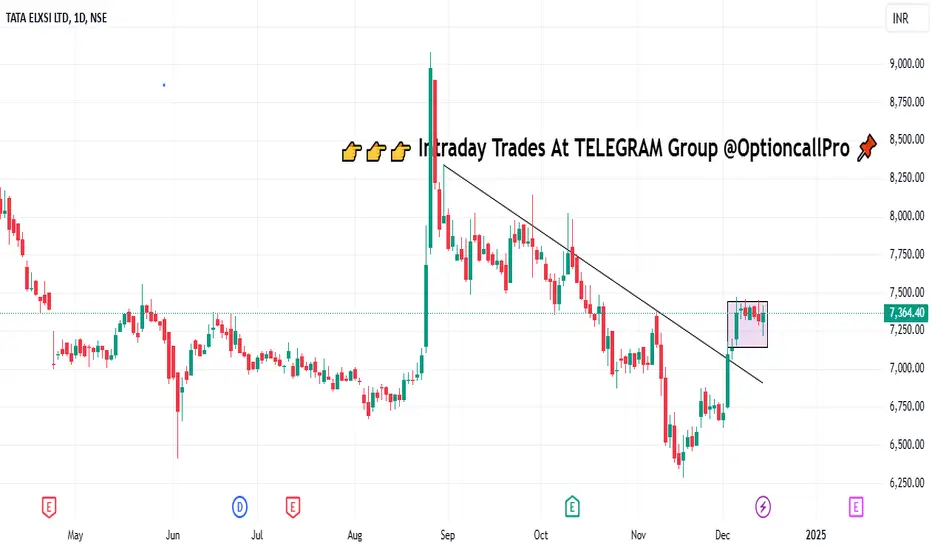
Tata Elxsi_Price Rejection With Bearish Engulfing Candle_ShortLooks Bearish
Bearish Engulfing candle
Breaks 200 DEMA & 20 DEMA
TATAELXSI trade ideas

TATA ELEXISTATA ELEXIS
MTF MTF-Zone TREND MTF Analysis Logic Proximal
HTF Yearly UP Tata ElexisYearly Demand RR 1888
HTF Half-Yearly UP Tata Elexis6 Month Demand RR 4350
HTF Qtrly UP Tata ElexisQtrly Demand BUFL RR 4350
HTF Average UP 3529
MTF Monthly UP Tata ElexisMonthly Demand BUFL 4575
MTF Weekly UP Tata ElexisWeekly Demand BUFL 5015
MTF Daily UP Tata ElexisDaily Demand DMIP BUFL 5015
MTF Average UP 4868
ITF 240M UP Tata Elexis240Mn Demand BUFL 5015
ITF 180M UP Tata Elexis180 Mn Demand BUFL 5015
ITF 60M UP Tata Elexis60 Mn Demand BUFL 5015
ITF Average UP 5015
Trade Points 4471
Trade Plan BUY TATA ELEXIS ENTRY-1
Entry-1 5015
Entry-2 4808
SL 4600
RISK 415
REWARD 5400
Target as per Entry 10415
RR 13.0
Last High 10000
Last Low 4600


Flag and pole pattern in Tata ElxsiIn monthly chart, it formed long pole and flag pattern, and recently it formed triangle pattern. Now in strong support. If market supports, it will be strong bullish. Breaking current levels with strong weekly candle, will be SL.

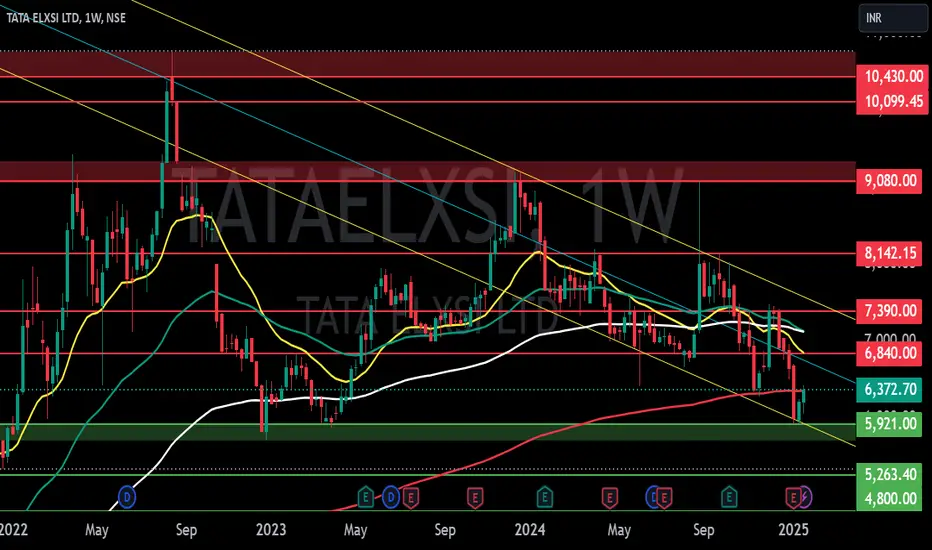
TATA ELXSI LTD S/RSupport and Resistance Levels:
Support Levels: These are price points (green line/shade) where a downward trend may be halted due to a concentration of buying interest. Imagine them as a safety net where buyers step in, preventing further decline.
Resistance Levels: Conversely, resistance levels (red line/shade) are where upward trends might stall due to increased selling interest. They act like a ceiling where sellers come in to push prices down.
Breakouts:
Bullish Breakout: When the price moves above resistance, it often indicates strong buying interest and the potential for a continued uptrend. Traders may view this as a signal to buy or hold.
Bearish Breakout: When the price falls below support, it can signal strong selling interest and the potential for a continued downtrend. Traders might see this as a cue to sell or avoid buying.
20 EMA (Exponential Moving Average):
Above 20 EMA(50 EMA): If the stock price is above the 20 EMA, it suggests a potential uptrend or bullish momentum.
Below 20 EMA: If the stock price is below the 20 EMA, it indicates a potential downtrend or bearish momentum.
Trendline: A trendline is a straight line drawn on a chart to represent the general direction of a data point set.
Uptrend Line: Drawn by connecting the lows in an upward trend. Indicates that the price is moving higher over time. Acts as a support level, where prices tend to bounce upward.
Downtrend Line: Drawn by connecting the highs in a downward trend. Indicates that the price is moving lower over time. It acts as a resistance level, where prices tend to drop.
Disclaimer:
I am not a SEBI registered. The information provided here is for learning purposes only and should not be interpreted as financial advice. Consider the broader market context and consult with a qualified financial advisor before making investment decisions.
TATA ELEXITATA ELEXI
MTF Analysis Price
TATA ELEXIYearly Demand 1,889
TATA ELEXI 6 Month Demand 4,350
TATA ELEXIQtrly Demand BUFL 6,730
TATA ELEXIMonthly Demand 6,379
TATA ELEXIWeekly Demand 5,999
TATA ELEXIDaily Demand DMIP 5,755
ENTRY -1 Long 5,999
SL 5,263
RISK 736
REWARD 4,001
Target as per Entry-1 10,000
RR 5
Last High 10,760
Last Low 5,263
ENTRY -2 Long 5,755
SL 5,263
RISK 492
REWARD 4,245
Target as per Entry-2 10,000
RR 9
Last High 10,760
Last Low 5,263
Trade Set Up
Buy Volume -1 As per Entry-1 200
Buy Volume -2 As per Entry-2 200
Average Buy Price 5,877
Trade Value 2,350,800
SL Point 5,263
RISK 614
Exit Target 10,000
Target Value 4,000,000
Profit Target 1,649,200
RISK Value 245,600
Risk to Reward 7

analysis the chart represents the trading activity TATAELXSI.Uptrends and Downtrends:
Uptrends occur when prices consistently make higher highs and higher lows. Imagine a staircase going up. These trends indicate bullish sentiment, and traders look for opportunities to buy.
Downtrends, on the other hand, happen when prices consistently make lower highs and lower lows. Picture a staircase going down. These trends signal bearish sentiment, and traders consider selling opportunities.
Consolidation (Sideways Market):
Sometimes, prices don’t move decisively up or down. Instead, they oscillate within a range. This is called consolidation or a sideways market.
In a sideways market, price bounces between two parallel and often horizontal trendlines. Traders watch for a breakout—when price finally escapes this range—to make their move.
Remember, these patterns aren’t just lines and curves; they represent the collective actions of market participants. Decoding them can be the difference between seizing opportunities and missing out. So, keep an eye on those peaks, troughs, and trendlines—they hold the secrets to market trends! 📈💡

Tata Elxsi swing tradeHello,
Trend-Based Analysis. Buy the Dips, Sell The Rallies, Also Following the Trend. Let's see where the Price Action takes us, Riding the wave. Potential trade setups based on trend momentum.
Technical analysis based on trend identification and momentum, Looking for high-probability setups within the prevailing trend.
Analyzing the current market trend and potential future price movement. Focusing on risk management and reward-to-risk ratios.
Details is Mentioned in Chart, Read carefully.. .
SAY TATA TO BEARS AND ENTER TATA ELXSI RALLYEverything is pretty much explained in the picture itself.
I am Abhishek Srivastava | SEBI-Certified Research and Equity Derivative Analyst from Delhi with 4+ years of experience.
I focus on simplifying equity markets through technical analysis. On Trading View, I share easy-to-understand insights to help traders and investors make better decisions.
Kindly check my older shared stock results on my profile to make a firm decision to invest in this.
For any query kindly dm.
Thank you and invest wisely.

Buy Tata ELXSI 40% gainTata Elxsi may give a buy signal according to range bound trading strategy if it falls more from the present levels. The lower point of the range is 6436 and the upper limit of this range is 9043. So you need to buy at 6436 and sell at 9043 for around 40% gain. The stock has covered this range for three times in the past. There is another range with lower limit 5895 and upper limit again as 9043. So you need to buy at 5895 and sell at 9043 for around 51% gain in the stock. The stock has covered this range for two times in the past.
Please do your own analysis before investing.
Hope you learned something new from my ideas.
Do like, share and follow me. Thank you!

90 Months Time Cycle in Tata ElxsiOut of all the time cycles the 90 months time cycle is special
Tata Elxsi recently completed its 90 months time cycle and you can already see fireworks
There is much gunpowder left in it and this rally for last for upto a year or even more!

Tata ElexisThis stock has reached its life time high of 10,780 in the year 2022. after that there is no movement and in down trend till March-2023
it delivered negative returns from last one year where the price was 7500 level in 05-July 2023 and 7057 as on 02-July-2024
Caution is required while taking position in this stock.. as the IT pack is moving positive, this may also show uptrend from this point of time.
Accumulation Zone 6885 - 6260
Strict Stop-Loss - 6410
Short Term Target - 7376 / 7515 / 8200
Long Term Targets - 8950 / 10186 / 10780 / 11412
Kindly consult your financial adviser before investing. this idea is education purpose only and not for real-time trading or investing

Tata elexiQtrly Demand 6800
Monthly Demand 6800
Weekly Demand 6800
First Target 8000
Fina Target 13000

Tata Elxsi can rise to old glory againTata Elxsi Limited, a part of Tata Group was incorporated in March 30th, 1989 as Tata Elxsi (India) Ltd. The Company is a global design and technology services company for product engineering and solution services across industries including Automotive, Broadcast, Communications, Healthcare, and Transportation. The operations are classified into two business divisions, i.e., Software Development and Services and Systems Integration and Support.
Tata Elxsi Limited CMP is 7088.15. The positive aspects of the company are Rising Net Cash Flow and Cash from Operating activity, It is a Company with No Debt and Company with Zero Promoter Pledge. The Negative aspects of the company are high PE (PE=56), MFs decreased their shareholding last quarter, declining profits and falling profit margins.
Entry can be taken after closing above 7132. Targets in the stock will be 7334, 7361, 7553 and 7797. The long-term target in the stock will be 8025, 8197, 8360 and 8539. Stop loss in the stock should be maintained at Closing below 6661.
The above information is provided for educational purpose, analysis and paper trading only. Please don't treat this as a buy or sell recommendation for the stock. We do not guarantee any success in highly volatile market or otherwise. Stock market investment is subject to market risks which include global and regional risks. We will not be responsible for any Profit or loss that may occur due to any financial decision taken based on any data provided in this message.

Tata Elxi Long
NSE:TATAELXSI has broken out on the weekly charts
IT sector will benefit alot in the future if rate cuts are going to take place in the US
Target: 9000
Further target: 10000+
Stop loss: 8350
Long term trade, even a no stop loss and adding on the dips would be good
Risk: Expectations of the Fed notbeing able to provide a "Soft landing" would result in the markets tumbling which would result in the stock going towars our stop loss level

$NSE:TATAELXSI Learnings - Time correction/opportunity costNSE:TATAELXSI
🔰Analyzing Tata Elxsi: A Case of Valuation & Earnings Stability ⤵️
🔰 PE Ratio Halved: From 100 to 50
✅ The PE ratio dropped from around 100 to 50, signaling a shift in market sentiment or correction from an overvalued state.
🔰 Timewise Correction, Not a Price Drop
✅ The stock has gone through a timewise correction with sideways movement instead of a steep decline.
↳ This often indicates consolidation after a significant rally.
🔰 Earnings Stability
✅ Despite the PE decline, EPS (Earnings Per Share) remains stable or slightly increasing.
↳ A positive indicator that the company’s earnings capacity is intact.
🔰 Market Sentiment vs. Fundamentals
✅ The PE ratio drop without a corresponding decrease in earnings shows a recalibration of growth expectations.
↳ Remember, valuation and market sentiment can diverge from a company’s actual performance.
🔰 Timing is Key
✅ Entering when valuation is high can lead to modest returns, even if the company performs well.
↳ Patience and strategic timing are crucial.
🔰 Long-Term Perspective
✅ Tata Elxsi’s stable earnings during a timewise correction show the benefits of holding strong fundamentals over short-term volatility.
🔰 Strategic Takeaway
✅ Look beyond PE ratios—understand the business, sector dynamics, and macroeconomic factors.
↳ Align your investment strategy with market conditions and company performance.


Tracking "TATA ELXI" for PossibilityThis Stock may soon come in the Breakout range and under control only, which has potential volume and price action
Note : I am Not a SEBI Registered Analyst. All Post and Levels Posting is only for educational and knowledge purpose. I Am not responsible for your any kind of loss or profit.
No Claim, All Rights Reserved.‼️


Tata Elxsi Monthly target for SwingTata Elxsi is at crucial support and expected to move up from here. For swing trading purpose we can keep at 1:2 ratio at current level to expect a target of 8400 approx in 1 Month.

Tata Elxsi giving encouraging signsTata Elxsi Ltd. is a global design and technology services company for product engineering and solution services across industries including Automotive, Broadcast, Communications, Healthcare, and Transportation. The operations are classified into two business divisions, i.e., Software Development and Services and Systems Integration and Support.
Tata Elxsi Ltd CMP is 7776.30. The Negative aspects of the company is High Valuation (P.E. = 60.8). The positive aspects of the company are Zero promoter pledge, FIIs are increasing stake, MFs are increasing stake, improving annual net profit, Improving cash from operations annual.
Entry can be taken after closing above 7858. Targets in the stock will be 8150 and 8591. The long-term target in the stock will be 8951 and 9188. Stop loss in the stock should be maintained at Closing below 7356.
The above information is provided for educational purpose, analysis and paper trading only. Please don't treat this as a buy or sell recommendation for the stock. We do not guarantee any success in highly volatile market or otherwise. Stock market investment is subject to market risks which include global and regional risks. We will not be responsible for any Profit or loss that may occur due to any financial decision taken based on any data provided in this message.

#Tata ELXSI making cup&handle pattern, 27% upmove possible?TATA elxsi on weekly time frame has made nice cup & handle pattern. And if we calculate the depth of this range then we can expect around 25-27% upmove till 10000/10294. Off course there are multiple resistances at 1) 8627 2) 8953 3) 9420(important FIB resistance) where booking some profit or trailing SL will make sense for me. Let's if this stock can give some fireworks on upside or not.
Happy Diwali everyone :)

