TATA Motors Daily AnalysisTATA MOTORS Joined its bull rally a few days back and achieved all times High.
But Is it the right time to buy TATA Stock?
Lets See -->
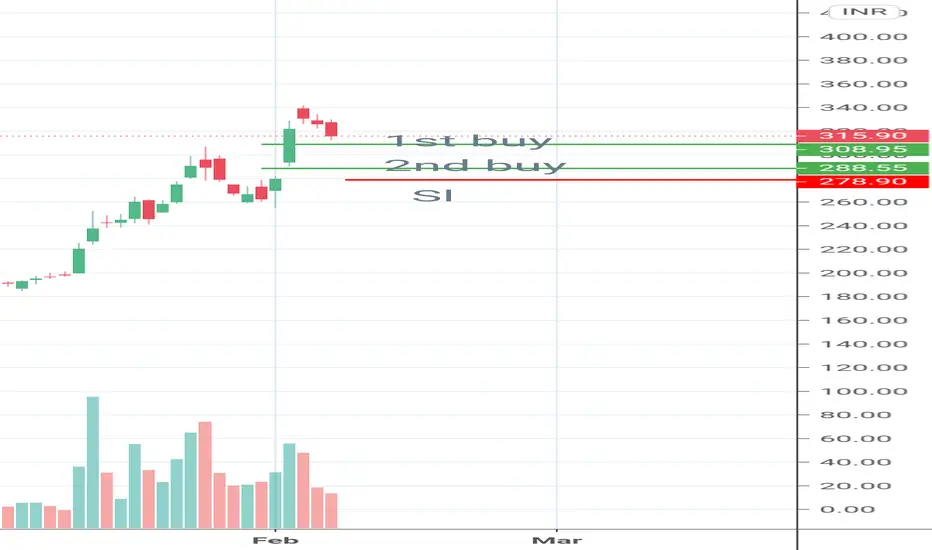
TATA Stock is in Supply Zone and at the top of the trendline of Ascending Broadening Wedge.
Ascending Broadening wedge serves as a Reversal Pattern, Which indicates Price will go further Down.
Also, In Hourly Chart Price is in Supply Zone and oscillating in it.
Although Bulls momentum is rising, one should wait for the breakout or Price bounce from the Supply Zone.
So, Until now The TATA Stock is in a Neutral Phase and one should wait for the price to break.
TATAMOTORS trade ideas


tatamotors not bullish viewOne can creat bull put spread in tatamotors. -1x300 PE and +1 280 PE for FEB 21 Expiry.
Reason :- It seems to be TM not Going to Break 300 LVL as It has Given Strong BO above 300 With Volume.


Tatamotors - Elliott wave analysis - 4th wave correction It is in 4th wave correction, which is expected to be zigzag abc down to complete it before it start running up in 5th wave.

TATA Motors 2021 complete projection with time speculation Hi
as earlier we had analysis the TATA motors I have made a complete analysis base on Fib and Price Action and Fibonacci time projection to project the times to see the market at a specific price.
we have some fundamental news that the said company is starting an electric section which is a revolutionary action and decision in the Indian car market industry which is a good sign and signals the growth in sentiment of this share.
i will update it periodically
please comment your ideas for us here

TATAMOTORS WEEKLY PRICE ACTION ANALYSISI have posted this chart earlier also for T1 & T2 now as it followed the price action very well, we can expect to its next level to T3 & T4.
Today it tested close to T3
Please share your views and suggestion on my analysis.
Thank you

bullishstock is weekly and daily bullish , price is rising with volumes. and price is above 200MA in weekly and daily time frame.
with sl( on 240) can be taken positionally

bullishour first price recommendation was 57 and 2nd time on 68 and now third time.
stock is weekly and daily bullish , price is rising with volumes. and price is above 200MA in weekly and daily time frame.
with sl( on 240) can be taken positionally


TaMo - Has it got it Mojo Back! WaitTaMo - Finally this stock has made shock waves. Started performing. The Daily/Weekly RSI crossed the peaks of 10 years. Will it now go a long way. It might, but it might also take a breather before the leap.
DISC: Not a SEBI Registered. I post charts for my own study.

Tata motors long long tatar motors , support broken , may see light retraccment but long term target 600+ cmp 280


TATAMOTORS Bullish Pennant.NSE:TATAMOTORS
Watchout it will be fire breaking upside, can go till 20-22-25 Points from CMP


Tatamotors - Elliott wave analysis -5th wave upIt is in 4th wave correction of up cycle and any sharp decline will be considered to be buy opportunity near 250 level for final move up as 5th wave up.

stock for watch -> TATA MOTORS - READY FOR BREAKOUT tata making rectangle flag and pole. if breakout will see good one side momentum. also, volumes are decreasing now.

Tata motors - Bullish Continuation PatternAfter a Big Up move, Stock is consolidating without much retrace.
Volume has dried at the upper level which indicates there are very less sellers at this level.
If breaks up, Next logical resistance is at 280.
Chart indicates a leg up soon.

Will historical price cycle continue?NSE:TATAMOTORS
Tata Motors had 4 deep price corrections (more than 75%) in the past including the one from mid-2016 to early 2020.
Of the previous 3 deep price corrections, every time it has given multi fold up move from its reversal price before seeing a deep correction again.
From May 2020, price has reversed from ₹63.5 and has already moved up 337% as of today. Will it give multi fold returns this time as well and repeat historical price cycle? Only time can tell.
Disclaimer: This is in no way an advice for investment. Please consult your financial adviser before making any investments.
