TATAPOWER trade ideas

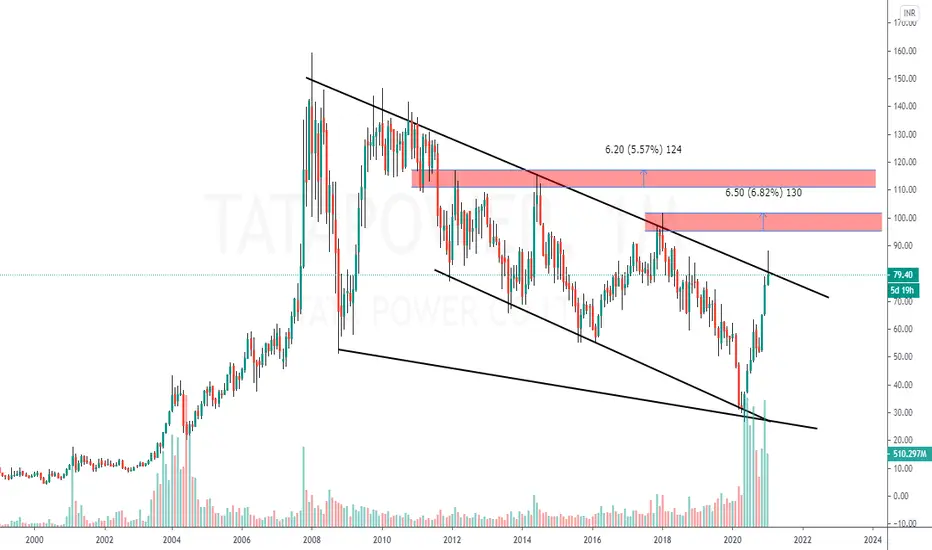
TATA POWER (POSITIONAL)1) TRENDLINE BREAKOUT
2) CAN GO LONG AT THE CMP
3)TARGETS WILL BE 116, 130, & 140


Ready for a Big breakout?A great swing pick. Seeing a good upside after a long days of consolidation in Tata Power, also a fundamentally strong company . You can enter into the trade with a target of 119 and 101.70 as a stoploss.

Tata Power Key levels are mentioned in chart
Disclaimer
I am not sebi registered analyst
My studies are Educational purpose only
Please consult with your Financial advisor before trading or investing


TATAPOWER still has energy to rise up!?TATAPOWER . Seems like it has energy to go u! watch out price at 124!


Look for channel breakoutTata Power Breaking and closing above 85 on monthly basis expecting target 105+ in coming days.
Lets see
Happy Investing!

breakout expected in TatapowerStocks to watch for 12/03/2021
Breakout expected
Go as per the break out .
Wait for the pull back .
Don't rush to buy/sell after breakout.
Time Frame to achieve target: max 10 days


TATA POWER LONG INTRADAY 3 MAR,2021Dear trader,
If u look at the chart of TATAPOWER (analysis based intraday only) the TATAPOWER support at 100 and target at 105 and stop loss at 96.
The chart clearly indicates Bullish Trend you can also see the candle stick patters for more in depth analysis.
TATA Power has broken a channel Pattern, It will likely see a upward rally.
Based target is to get a 50% upside from here.
In Intraday most important thing is to enter and exit points.
Our signals are based on analytics, algorithms, mathematical derivatives.
Always be a responsible trader, kindly trade only when you have maximum opportunity in the market with minimum risk and with keynotes like data, analysis and proper strategies.
Kindly message us for strategies and analysis.

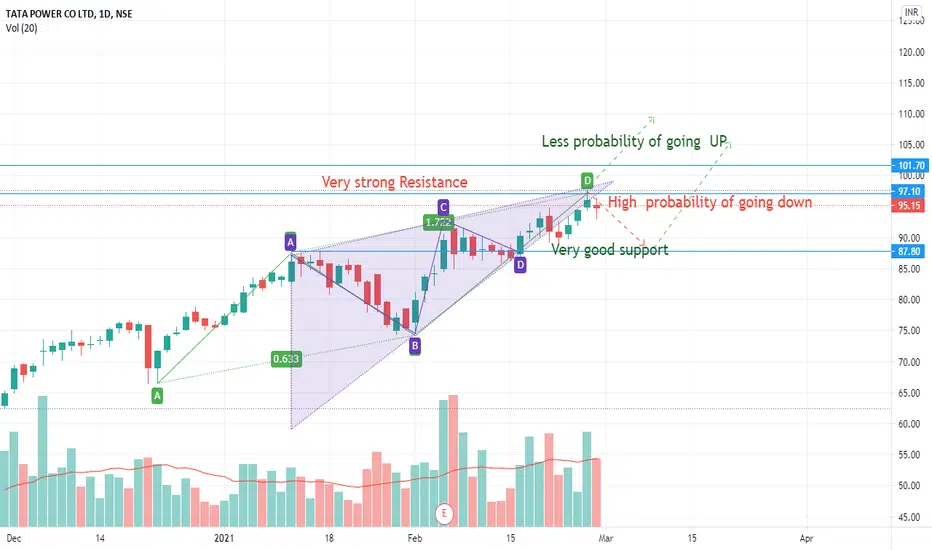
TATAPOWER watch out and Go short and then go Long TATAPOWER . Very interesting price action! It formed bearish AB=CD pattern and it is further confirmed by very strong resistance at 97.1. But if you pay attention to volume, it is above average! So my guess is that, there is less probability it can go up and high probability price can go down. If price goes does, it can find support at 87.8 and may bounce to 101.7. Let's see!

Tata Power: Will it show some Power & Emerge as a Multibagger!! - Breaking of two patterns - chanell & flag pole
- Volumes increasing
- I think it will become a multibagger(3x-5x) stock
- View for 2-3 years.
Dis. : I am not a sebi registered analyst. Sharing for purely information only
Personally invested from 60 levels more added on 88 levels.


TATA POWERTATA POWER has been rallying from the level of 80 and appears to be consolidating for a follow-up rally up to 100. The stock is being traded-in good quantity daily and there has seen significant additions in the segment as well.
Buy - ~88
T1 - 92+
T2 - 100+
SL - 87
Triggers -
Improved earnings reported in Q3.
It has been said that the business hasn't been drastically impacted by the COVID.
Emphasis is laid upon clean and green energy in Union Budget.
NOTE- Hourly time frame chart is being used here to clearly depict the target levels and support levels. The stock has been treating the level of 88-90 as a strong support zone. T1 and T2 are expected to be achieved in the coming 2 weeks.

TATA POWER BUY www.tradingview.com
PRICE : 90.5 TO 91.5
SL : 86
TARGET : 95.6, 98.5, 103.25
STRICTLY FOLLOW SL ON COLSING BASES

