TATAPOWER trade ideas
Tata Power Is Going To Blast Big..Looks like Tata Power is breaking out big.
Target 500 to 800 (Fundamental Target).

Neutral Right now at very imp support tend it might show some bullish move from here
if this level broke next target is 66

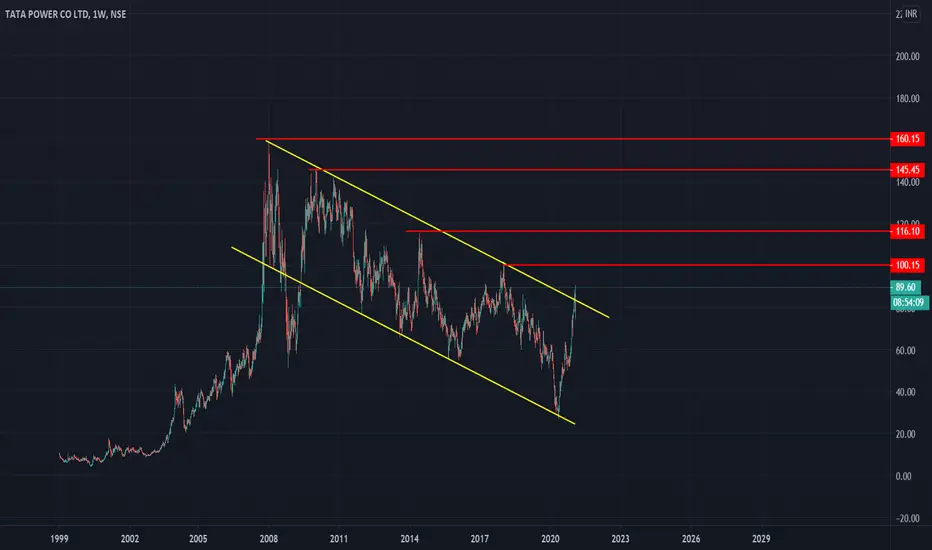
TATA POWER - Multibagger StockTata Power is expected to break 10 Year Downward Channel, Trading with high volumes from the past 3-4 months.
RSI is also expected to breakout from the crucial level.
If Price crosses the trend line around 85-86 levels, Hold for a minimum of 140-150 levels.
Tata Power fundamentally looks very strong and is underrated as compared to stock price. Expected to fire like TATA MOTORS.


Tata Power- Channel Breakout on Monthly chartThe stock has broken out of its 10-12 year channel on the monthly charts. Volumes are huge. We have to wait for january to end to see whether this breakout sustains or not. It definitely looks interesting.
p.s.- I may be biased as i am already invested from lower levels.


Tata power about to loose momentum? NaaahAfter a long bull run from around 27 to 78 , I personally see there is a strong chance around 80-84 it will face major resistance . I'm holding this stock from 54 ,technically there is a major resistance but the reason why I will still hold this stock is because its FUNDAMENTALS are getting stronger ,promoters are buying the stock .

inverted head and shoulder on tata powerits not perfect but as forming on horizontal boundary can consider it.
paper trading
as we miss accumulation we are conservative on position sizing
sl will be 49 on weekly closing i.e. if it break 49 on daily come out and close above 49 then re-entry as
we don't know how much fall will be there with volume so this way we are safe from high speed fall.
target is all time high. so be ready with patience as it will take long to hit.
becoz it took almost 1 year to form
be patient eventuallylong term wealth will be generated.
avoid news


Tata Power - December target Rs. 80++Here is a snapshot of what Tata Power is doing in December 2020.
My target for this is Rs. 80++ (hopefully before Nifty correction starts)


TATAPOWER - Breakout - Intraday/Very Short Term TradeThis analysis is purely based on price action and Chart Patterns.
The analysis is on 15min TF hence target can be achieved in intraday trade or in couple of days
Trade logic with SL and Target is explained in image itself.
Check the idea linked below to understand the Breakout on Daily Time Frame.
Entry can be made above the high of breakout candle on reversal signs.
Don't chase the price.
Always plan your trade & trade your plan
Keep trailing SL accordingly once entered into the trade.
Trade at your own risk and money management. Do your own study before taking any trade
Feel free to comment for any queries & suggestion


Tata Power - LongTata Power CMP - 64.90
Looking bullish in higher time frame. One can go for Intraday / Swing Trade setup with the following entry, exit & targets
Buy at or Above 65 ONLY / Stop Loss - 62
Target 1 - 68
Target 2 - 70
Target 3 - 72 / 75
Short Term Targets - 75 - 90 / Stopl Loss 57
Disclaimer: This is my view and for educational purpose only.


Tata Power looks goods for investmentTata Power looks good for investment... Trend line breakout + cup and handle breakout.. keep sl as per ur setup.

Inverse H& S Breakout👉 Inverse H& S Breakout in weekly chart and candle strong closing in weekly chart.
👉Upside 50% from CMP.

TATAPOWER - Bullish H&S Pattern - Swing tradeThis analysis is purely based on price action and chart pattern.
Analysis is done on daily TF hence it may take several days to couple of weeks to reach its target. Traders can also take advantage of this analysis in intraday trades.
Trade Strategy along with logic is explained in image itself.
Always plan your trade & trade your plan
Keep trailing SL accordingly once entered into the trade.
This analysis is purely for education purpose. Kindly do your own study before entering into any trade .
Feel Free to comment for any query and suggestion.

Tatapower with a Bullish Chart - Inverted Head and ShoulderHi Friends,
TATAPOWER is making a nice Inverted Head and Shoulder in a Weekly Time Frame. And also, it looks like a Cup and Handle.
It is good to go long once it breaks the Rs .64 level and possible upside till 94-100. I hope you benefit from the chart published here.
- MetaVish
NSE:TATAPOWER

