TATAPOWER trade ideas


Tata Power Co : Buy OpportunityI have shown the pattern on the chat. There seems a good buy opportunity with the retest as well.

Breakout in TATAPOWER (Weekly Time Frame)This analysis is for short-term swing trading opportunities (ranging from few days to few weeks). The analysis is purely based on price action on weekly time-frame.
As can be seen in the image, the trend-line has been acting as good resistance till it was broken on 10th August 2020 with increased volume . The stock touched its life-time bottom and then from there, it started an up-trend (higher-highs and higher-lows). As this uptrend continued, large increase in volume can be seen on charts (stock never saw such huge volumes in its lifetime).
After the breakout with volume confirmation, the price went up little and came down to retest that support level (same trend-line). As can be seen from the charts, price has got good upward rejection from that support. Also, if we use Fib-Retracement tool, we find that the support level is at 0.382 level which shows strength in on-going uptrend.
Trade strategy can be - to enter on the high of next green candle (entry can be made on daily time-frame as well on the high of previous-day candle). SL can be taken below 0.382 level = 49 or preferably below 48-47.5 level.
For Targets, there are two options - Either take previous swing highs as targets (marked with horizontal rays in red colour). Or target can be deduced with help of Trend-based Fib Extension tool (as shown in image). Target-1 as per that tool will be 72, Target-2 = 78 and Target-3 = 83 level.

Breakout in TATAPOWERThis analysis is for short-term swing trading opportunities (ranging from few days to few weeks). The analysis is purely based on price action on weekly time-frame.
As can be seen in the image, the trend-line has been acting as good resistance till it was broken on 10th August 2020 with increased volume. The stock touched its life-time bottom and then from there, it started an up-trend (higher-highs and higher-lows). As this uptrend continued, large increase in volume can be seen on charts (stock never saw such huge volumes in its lifetime).
After the breakout with volume confirmation, the price went up little and came down to retest that support level (same trend-line). As can be seen from the charts, price has got good upward rejection from that support. Also, if we use Fib-Retracement tool, we find that the support level is at 0.382 level which shows strength in on-going uptrend.
Trade strategy can be - to enter on the high of next green candle (entry can be made on daily time-frame as well on the high of previous-day candle). SL can be taken below 0.382 level = 49 or preferably below 48-47.5 level.
For Targets, there are two options - Either take previous swing highs as targets (marked with horizontal rays in red colour). Or target can be deduced with help of Trend-based Fib Extension tool (as shown in image). Target-1 as per that tool will be 72, Target-2 = 78 and Target-3 = 83 level.

TATA POWERAfter breakout nearest target is 61. Reversal after taking support at 54 is done. Hold with medium term target 72.


Supply and Demand Gap- A guide to possible move"This is my trading journal, not a trade recommendation. Will be Posting and updating the ideas regularly in related ideas linked below, as market progresses, only for educational purposes for me and others who want to benifit from my experince. You can see the journey till date in linked related idea below - Tata power: 3D analysis(Prices in Transition zone)
DISCLAIMER:
Trading in the stocks market or futures markets is one of the riskiest forms of investments available in the financial markets and suitable for sophisticated individuals and institutions. The possibility exists that you could sustain a substantial loss of funds and therefore you should not invest money that you cannot afford to lose. Nothing in this analysis is a recommendation to buy or sell stocks or futures and I shall not be liable for any loss or damage, including without limitation, any loss of profit, which may arise directly or indirectly from the use of this analysis or reliance on such information. Consult your financial advisor prior to investing is stock market.
This is one person’s experience, your experience may differ. Past perfomance is not gaurantee of future gains.

Short Term SHORT and Long Term LONGTechnically we can see Elliot correction wave so there may be correction at present and once it is completed then we can expect a bull run in Future .. This is bcoz MONTHLY TYM FRAME is inside the channel and heading towards the top of the channel.

Short Term SHORT and Long Term LONG Technically we can find Elliot correction wave is going on here and once it completed. We can expect a bull run. Bcoz in WEEKLY TF it is inside the channel and heading towards the top of the channel.


Tata PowerTata Power CMP 61
Upside can show levels of 100 in coming days
Sl 45 on CLBS on Weekly Basis


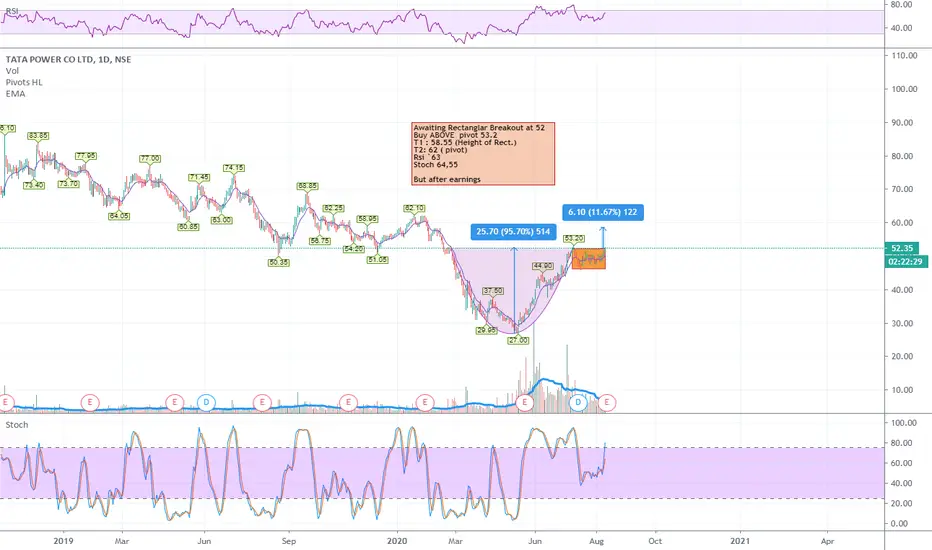
Tata Power - Cup and Handle Awaiting Rectanglar Breakout at 52
Buy ABOVE pivot 53.2
T1 : 58.55 (Height of Rect.)
T2: 62 ( pivot)
Rsi `63
Stoch 64,55
Initial a rectangle break out setup.
If volume and momentum continues Cup target can be recognized.
But after earnings
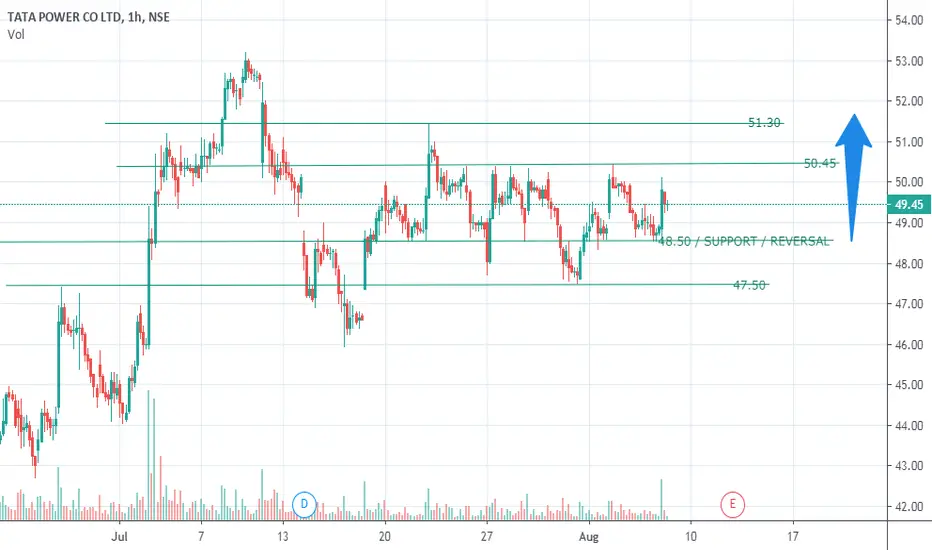
TATAPOWERNSE:TATAPOWER
48.50 ARE THE SUPPORT LEVELS THAT IS WHERE THE ENTRY LIES AND TARGETS HAVE BEEN GIVEN ON CHARTS
******************************************************************************************************************************************************************
Hi all,
Its pleasure to have you all here.
I have started putting these charts as a contribution from my side to all people who are new to business, as I had to struggle a lot without any sources at disposal. So please consider this a just small contribution from my side.
Few Honest Disclosures:
1. Any idea shared is my personal view, its not a recommendation, neither any kind of paid propaganda, so please
do your bit of research.
2. Ideas shared does not mean that I trade all or have position in them, this is just a helping hand to all.
3. I expect no comments or like nor any negativity, as I said its just a small helping hand from my side, please plan your risk and trade as per your capacity.
4. To trade in Cash, options or futures is your sole choice and your own risk
5. I am no expert in Tech Indicators, I believe in support resistance and trendline theory, you may use this as a supplement theory for better results.
6. I work for my own living, this is a hobby which I do sincerely to help anyone who might come across my charts.
***********************************************************************************************************************************************


TATA POWER - Supply Zone - Longs ExitNSE:TATAPOWER is struggling near supply zone. One may book long positions here.

tata motors can be bullish tomorrowpositive news Plus bullish triangle pattern shows that we can work on long side

TATA POWER - Levels of referenceNSE:TATAPOWER it is not good to chase at this level. wait for pull back to add lings

buy at dipsbecoz all indicators are in bullish support and volume wise it is also a good stock and open interset is also increasing

TATA POWER LEVELS AND TARGETS GUYS!!THE STOCK LOOKS VERY BULLISH AT THIS MOMENT. CAN BUY FOR SUGGESTED TARGETS.
CONSIDERING THE FACT THAT THEY WILL BE RECEIVING FUNDING OF 2600 CRORE FROM TATA SONS.
LET'S SEE HOW THIS PLAYS OUT. KINDLY CONSULT YOUR FINANCIAL ADVISOR.
HAHAHAHAHAHAH LET'S GO JAI HIND
