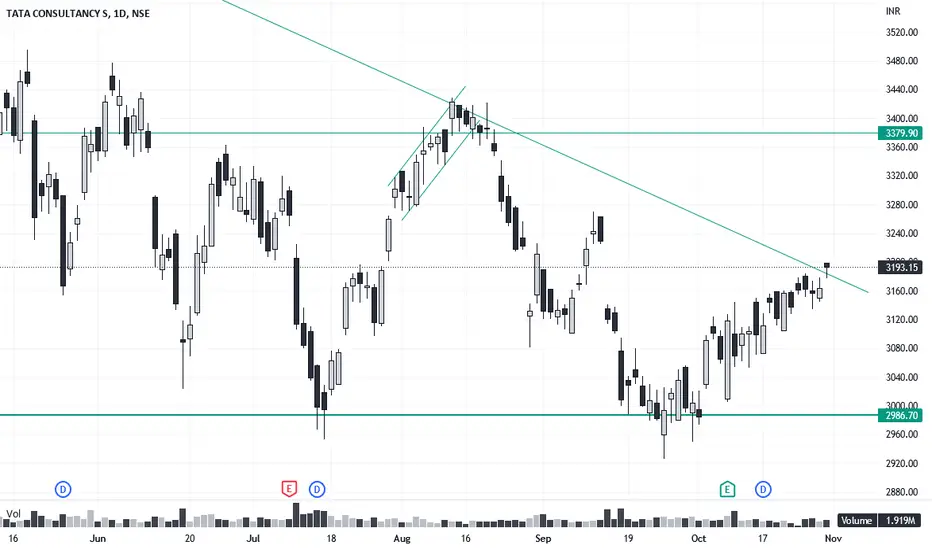
TCSBroke out of falling trendline. Retest successful.
RSI supporting the move. 50 dema will try to make golden crossover with 200 dema.
T1: 3600
T2: 3800
SL: 3200 (Daily Closing)
TCS trade ideas

Tcs break the Double bottom neck line Tcs Break The Double Bottom Neckline
We can expect 8 To 10 percent given WITH IN 2 Months

TCSHeavy weight IT stock , Nifty IT good Break Out , Keep on watch list , I am expecting uptrend
Dont miss chance ,do your own analysis, I am sharing for Knowledge purpose

TCS broke the resistanceTCS Broke the resistance 3400
Though it is in overbought zone still wait for confirmation as all IT stock will move soon

TCS In buy Trend for this weekBuy TCS once it crosses and sustains 3324-3330, tgt 3400
Shoeing higher high and higher low pattern, which indicates a Bullish pattern on TCS
* For educational purposes, just putting my thoughts not recommending anyone

TCS
TCS LOOKING BULLISH
ABOVE 10 , 21 , 63 , 100 , 200 EMA
MOVING UP WITH HIGH VOLUME - we may see the levels mentioned in the chart !!
With SL 3265
swing tradingtcs15 % ki swing trading ab tcs me .. tcs break triangle break out , and reach level all time high

TCSIn previous chart we have bullish and also we have a bullish on this chart I'm going to buy for swing trade if price cross 3272

TCS - Short Term viewTCS is currently travelling in the upward channel. It may go up until it breaks the bolded trendline. In case it breaks, it may come down ~ 3280 - 3300 by end of this expiry
Incidentally, 38% of retracement from Jan 22 fall comes arond 3358. Closing above may lead to ~3500 which is at 50%.


TCS breakoutWait for Channel breakout To be happened .. IT stocks bulls are returning after the inflation numbers in US

TCS high potential breakout After a beautiful consolidation, IT stocks bulls are likely to return ...pls double check your view on this stock

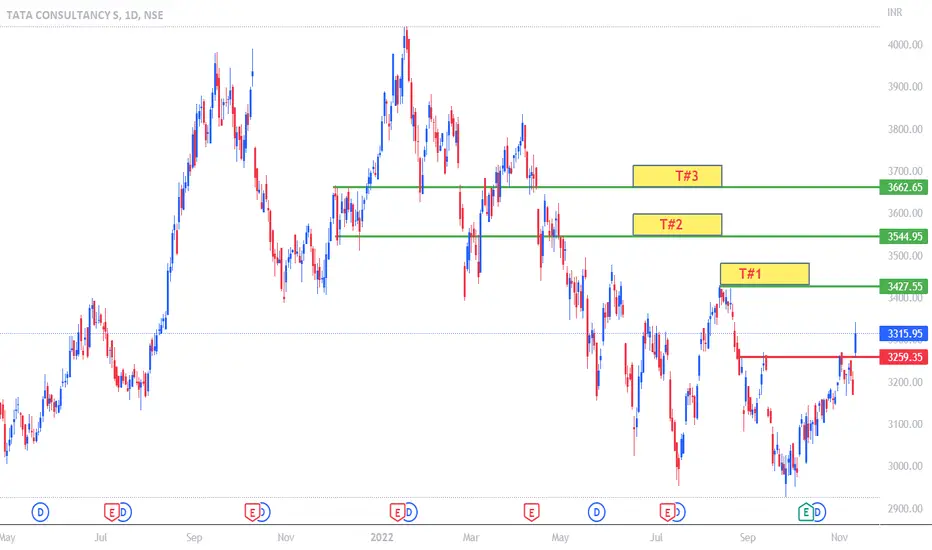
TCS IMPORTANT LEVELSTCS has made double bottom and making higher high and higher low formation hereafter we can plan for swing trades and investment.

Long Investment Seems the share going to hit ATH. after some fall. can accumulate from now. 2 years timeline


Trendline Breakout in TCSTcs and entire IT sector under selling pressure
Because of Fii selling it stocks
Now fii buying IT stocks
Tcs currently breaking trendline
Good above 3250 for target of 3500
3800

TCSTcs makes bottom now it can go up or consolidate here the trendline can be magnetic line if market goes bullish then highly possibilities to go up......

TCS BULLISH Pinbar at breakoutTCS very bullish at CMP 3217, SL 3160, Targets- 3400, 3500, 3700
TCS just broke out of a year long downtrend, and with less than a 3% risk, one can aim for amazing returns.
This idea is based on the pinbar on the last trading day and for a better trade, advisable condition would be a breakout above 3275 with an SL of previous swing.

#TCS Weekly Major Support & Resistance Levels.Providing Weekly Support and Resistance levels for next coming week based on Central Pivot Range and its major support & resistance levels of week, where price can take support and face resistance. Three black lines indicating weekly Central Pivot Range. Previous week high & low also performs as a major support and resistance levels. Can take long & short positions according to how price perfoms at particular given support & resistance levels.


TATA CONSULTANCY SERVICE !Good Buying Opportunity until level 3399 ! with high probability up to 85%


TCS BreakoutTCS appeared to have broke the down trendline. 3400 seems to be the immediate target if NASDAQ supports the IT index