TCS trade ideas

TCS CHART VIEWRSI divergence is being seen from a long time as shown in the chart. Also TCS is showing signs of making a short term top near these levels.
Hence, It would be wise to stay away from this stock for the near term.


SEND TCS TO NEW ATH ₹4500The most powerful stock right now is TCS.
Bullish consolidation in continuation.
Just needs technical analysis NSE:TCS to trade this, forget the news.
EVERYTHING IS PRICED IN THE CANDLES.


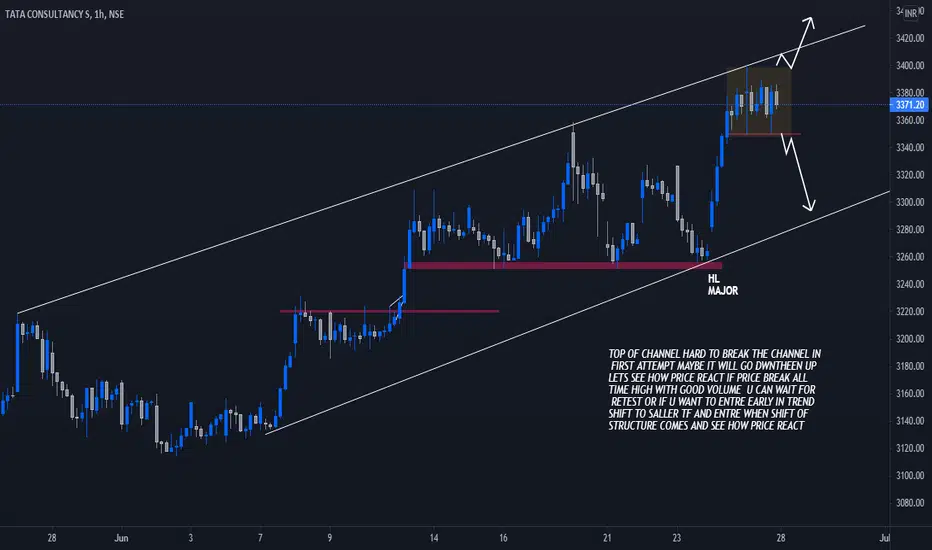
TCS TF 1HR CONSOLIDATINGTCS CHART PAUSE IN TREND AFTER BREAKOUT IT MIGHT BE THE MEASURED MOVE UP
TOP OF CHANNEL HARD TO BREAK THE CHANNEL IN
FIRST ATTEMPT MAYBE IT WILL GO DWNTHEEN UP
LETS SEE HOW PRICE REACT IF PRICE BREAK ALL
TIME HIGH WITH GOOD VOLUME U CAN WAIT FOR
RETEST OR IF U WANT TO ENTRE EARLY IN TREND
SHIFT TO SALLER TF AND ENTRE WHEN SHIFT OF
STRUCTURE COMES AND SEE HOW PRICE REACT


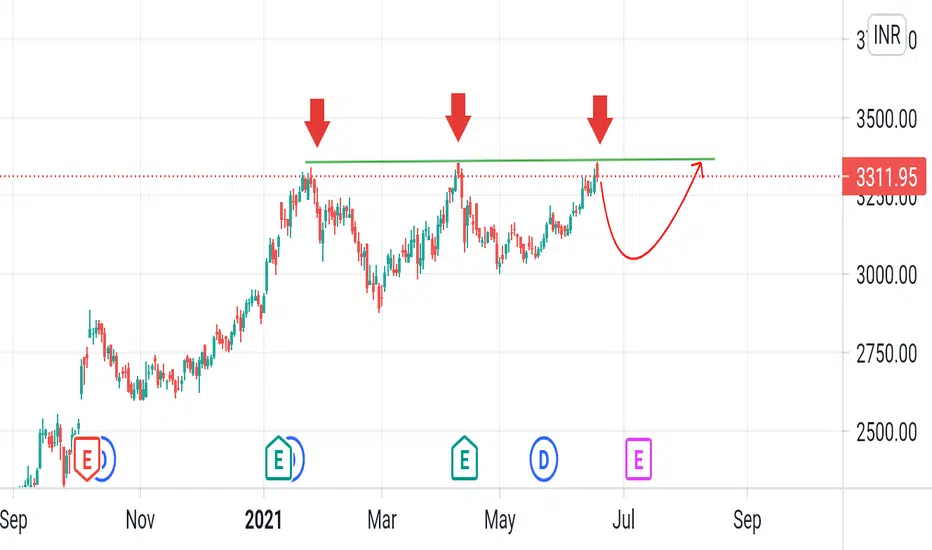
tcsTCS has reached its crucial level of resistance on daily chart. Keep an eye on it, if it breaks that an awesome upside movement can be witnessed. What makes me more confident of a breakout is the formation of double bottom too.
Pure price action , no fancy indicators.

TCS - Ascending triangle bullish breakout with good volumeChart is self explanatory.
Don't invest and trade blindly.
Do your own analysis.
Note: This is not a stock recommendation.


TCS Ascending triangle breakoutBIG BREAKOUT! ALL TIME HIGH
Targets would be 3600, 3800 on swing levels
Stoploss would be a close below 3320 levels on daily charts

Long above 3370 Trading all time high
Bullish trend.
Strong trendline support
Huge volume accumulation

TCS longstrong closing above resistance zone and can be a good puck around these current levels for the above shown targets, strict stop-loss on closing below the level given.
THIS VIEW OF MINE IS PURELY BASED ON TECHNICALITY OF CHART, BEWARE OF NEWS.

TCS TCS took resistance at 3327 that is good rejection point. I think it will retest or fall up to the supply zone that is 3262 to 3247 ( resistance zone )

TCS@3306 Make or Break LevelTCS is making higher lows and is trading at High with rising rounding pattern which looks good, but current price is more than the intrinsic value. Therefore it's suggested to wait till it corrects to S2 levels as specified on the charts.
If there is breakout with volumes then wait for to get price @3306 or if you are looking to enter at current price then invest 25% of the capital and further can invest accordingly at the dips .
Fundamentally very strong stock. Any correction is buy opprtunity
PIVOT LEVELS
R1 R2 R3 PP S1 S2 S3
Classic 3,345.20 3,393.10 3,428.20 3,310.10 3,262.20 3,227.10 3,179.20
Bullish Momentum - Above Short, Medium and Long Term Moving Averages
1.83% away from 52 week high
Outperformer - Tata Consultancy Services up by 6.75% v/s NIFTY 50 up by 3.81% in last 1 month
F&O data suggests Long Unwinding today
Disclaimer:
The views provided solely for information purposes, and is not an offer to buy or sell or a solicitation of an offer to buy or sell any security or instrument or to participate in any particular trading strategy. The information presented is for general information purposes only. Although every attempt has been made to assure accuracy, I assume no responsibility for errors or omissions

TCS under ascending triangle formation Going long TCS to be considered if it doesnt break out the current high of 3350 zone.
Expecting the stock to form ascending triangle pattern before giving a break out to next price levels


TCS trading ideasTCS sell from CMP and sl 3358 trgt 3100 there's a supply zone I see fall can seen till 3100 then again it'll move up by curve swing.
Tcs is always a market MAMMOTH.....Tcs has huge upside... it is always a Market MAMMOTH.. Has upside of 4600.. NOW JUS AT 3280..
THATS NEARLY 40% UPSIDE .. & More over great dividends also..

TCSTCS is follow this lines
When it's cross 3290 then Target is 3350
And hear stoploss is 3265
it's follw falg Pattan when it's brack then boom 🔥
