Tor Pharma { 15 M Long }IB formed , we 'll Long as it breaks
rest is as per charts
Note :-
Entry - At the break of mentioned candle's low/high
Stop Loss -
In a Short Trade, I always use Previous Candle High ( PCH ) as a stop loss while entering the trade. Sometime I might use 15 M tf SL & trade in 30M tf which I'll mention. Vice Versa for long trades
Trailing Stop Loss ( TSL ) - Mostly I trail stop loss by PCH as price falls . I exit as PCH breaks & vice versa
Use of PSAR as TSL :- TSL get's hit in trend following due to noise, In such cases I use PSAR to be in trend & exit if PSAR direction change
You can use any one of above mentioned or your own way to manage risk
Time Frame :- I take ~ 90% of my intraday trades in 15m tf. Where my analysis might come from higher frames like W , D or 1hr chart pattern which will be mentioned.
Target :- I do set target line based on support / resistance slightly above/ below it . Please pay attention to it
TORNTPHARM trade ideas

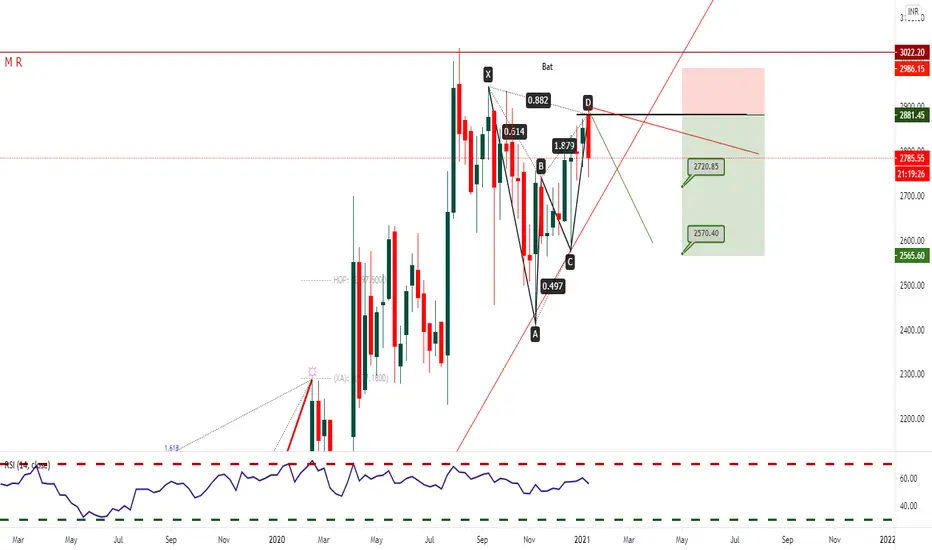
TORNTPHARM Daily WEEKLY Bat Zone + Daily BEARISH SHARK Strong POTENTIAL REVERSAL ZONE
price need to follow Green Trend line & hit target
If price Breaks Red Trend line is where EXIT before SL hits
POTENTIAL SELL

TORNTPHARM WEEKLY BEARISH BAT
price need to follow Green Trend line & hit target
If price Breaks Red Trend line is where EXIT before SL hits
POTENTIAL SELL


torrent pharma broken long term resistance ( Bull Call Spread)mildly bullish on the stock after the breakout
bull call spread can be initiated with {{buy 2700CE @ 143}} and {sell 2800CE @94}
cost of initiation 12k for a target of 12700. further quantity can be added once 2800 is broken

Torrentpharma - heavily bullishTorrentpharma gave swing breakout with positive rsi and macd. A huge volume show something is behind all this, My fav scrip for few days, lets see how it reacts. Targets on chart...

#TORRENTPHARMAThis highly under-rated pharmaceutical stock breaking out this week from very narrow consolidation happening since past couple of months. Could break its ATH in this rally. Let's see.

TORRENT PHARMA - CUP & HANDLE Pattern - Intraday/Short TermThis analysis is purely based on price action and Chart Patterns.
The analysis is on 15min TF hence target can be achieved in intraday trade or in couple of days
Trade strategy is explained in image itself. Don't chase the price.
Always plan your trade & trade your plan
Keep trailing SL accordingly once entered into the trade.
Trade at your own risk and money management. Do your own study before taking any trade
Feel free to comment for any queries & suggestion

Torrent Pharma - Looks to scale backMay be some news brewing or may be just the push for #NiftyPharma but torrent Pharma is all set to resume upwards journey with highly favourable risk reward ratio:
1. Closed above 23.6 percent fibo Retracement
2. RSI upturn from above 40 levels
3. Support line created for stop loss

Torrentpharma Support and resistance Torrent pharma descending triangle pattern on a hourly chart. It is near its support. If broken can give good short move


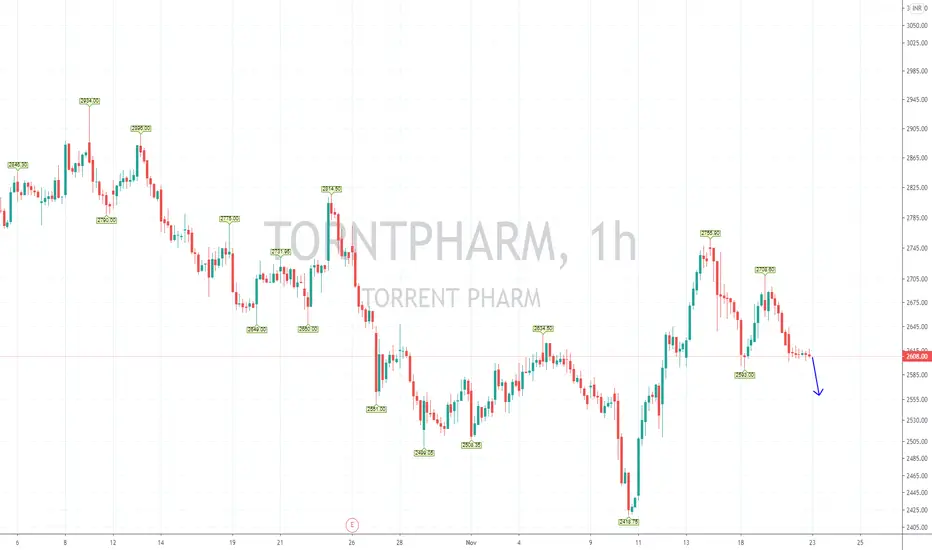
Torntpharma - ShortTornt Pharma CMP - 2609.90
Looking bearish in higher time frame. One can go for Intraday Trade setup with the following entry, exit & targets
Sell at or Below 2601 / Stop Loss 2614
Target 1 - 2590
Target 2 - 2580
Target 3 – 2570 / 2560
Disclaimer: This is my view and for educational purpose only.
TORNTPHARM LOOK OUT FOR THESE LEVELS!!! ALL THE LEVELS AND PATTERNS ARE MARKED ON CHART, RED ZONES DENOTES SUPPLY ZONES AND GREEN IS FOR DEMAND ZONE .
SELL AT 2589
The indicator used:
1) Daily Lines plots Daily 20 (BLACK) & 50 EMA (GREY) on lower time frame charts
2) TE-REKAB
- PB : PULLBACK
If you like the analysis, do leave a like and follow for more such content coming up.
The analysis is my POV, hope you got bucks in your pocket to consult a financial advisor before investing :P :)
HAPPY TRADING!

#TorrentPharmaNSE:TORNTPHARM was consolidating for a good time. The Falling Wedge Pattern is broken and we might see a good upmove since higher TFs are bullish.


Retest with Dragon FlyTorrent pharma has retest and created a dragon fly on daily chart. Good for going long for 20% gain

Torrent Pharma Analysis - 02-02-2020Torrent Pharma is in a good Uptrend.
Profit Target - Around 2,111
Stop Loss - Below 1,688
