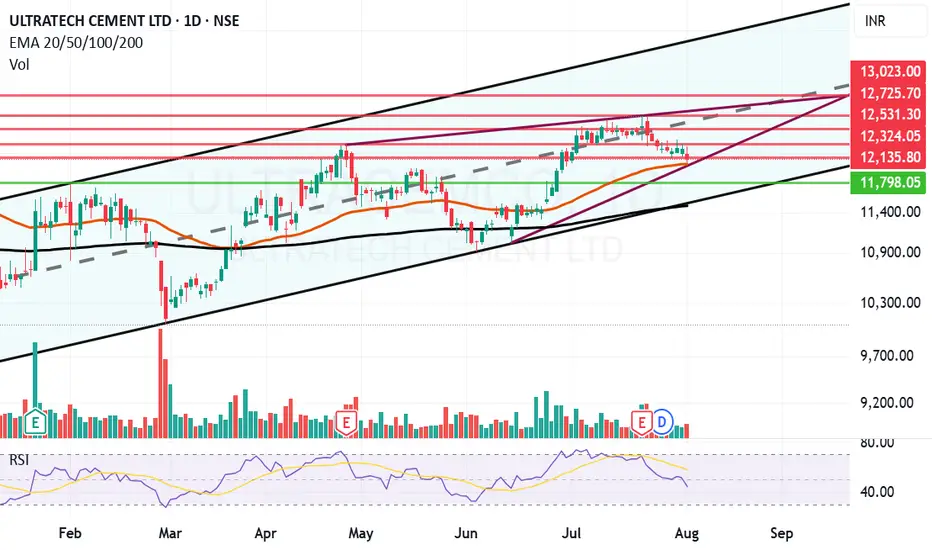
Ultratech can bounce back from Motherline support. UltraTech Cement Ltd. is a holding company, which engages in the provision of manufacture and sale of cement and cement related products.
UltraTech Cement Ltd. Closing price is 12113. The positive aspects of the company are Companies with Zero Promoter Pledge, Companies with Low Debt, FII / FPI or
Next report date
—
Report period
—
EPS estimate
—
Revenue estimate
—
239.50 INR
60.39 B INR
750.80 B INR
116.65 M
About ULTRATECH CEMENT LTD
Sector
Industry
CEO
Kailash Chandra Jhanwar
Website
Headquarters
Mumbai
Founded
2000
ISIN
INE481G01011
FIGI
BBG000PZ2JT9
UltraTech Cement Ltd. is a holding company, which engages in the provision of manufacture and sale of cement and cement related products. Its products include ordinary portland cement, portland blast furnace slag cement, portland pozzalana cement, white cement, and ready mix concrete. The company was founded on August 24, 2000 and is headquartered in Mumbai, India.
Related stocks
Ultracemco , 1W , Bullish As Ultracemco is Formed pattern and giving Breakout Now , Watch Carefully after Weekly Confirmation and Take Trade and follow proper Position Sizing and Risk according to your account size
follow for More Swing Ideas like this

ULTRACEMCO - 1 year INVERTED TRIANGLE══════════════════════════════
Since 2014, my markets approach is to spot
trading opportunities based solely on the
development of
CLASSICAL CHART PATTERNS
🤝Let’s learn and grow together 🤝
══════════════════════════════
Hello Traders ✌
After a careful consideration I came to the conclusion that:
-

it may start new 1stbest buying opportunity, when breakout buyers got trapped.you should enter here.

UltraTech Cement Ltd is testing a strong resistance level aroundA breakout above this zone with volume confirmation may trigger a bullish move, making it a buy recommendation if it closes above ₹11,850. The next target would be ₹12,050, with a stop loss at ₹11,690. However, if the price gets rejected at resistance, it could lead to consolidation—so wait for a de

ULTRATECH CEMENT LTD Swing tradeHello,
Trend-Based Analysis. Buy the Dips, Sell The Rallies, Also Following the Trend. Let's see where the Price Action takes us, Riding the wave. Potential trade setups based on trend momentum.
Technical analysis based on trend identification and momentum, Looking for high-probability setups with

POV: ULTRACEMCO - Edge of Channel BreakoutPOV: ULTRACEMCO - Edge of Channel Breakout
1️⃣ Channel Formation:
The stock has been trading in a range of ~12–14%, forming a channel. The top of the channel has been tested 4 times, confirming it as a strong resistance zone.
2️⃣ Last Leg Setup:
The last leg started with:
- A doub

UltraTech Cement Ltd Technical Analysis### **UltraTech Cement Ltd Technical Analysis**
#### **Key Chart Observations**:
1. **Resistance Breakout Zone**:
- The stock is approaching a **critical resistance level** near ₹12,080.
- A breakout above this level with strong volume could signal a bullish continuation.
2. **Trendline Anal

ULTRATECH CEMENT LTD swing tradeHello,
Trend-Based Analysis. Buy the Dips, Sell The Rallies, Also Following the Trend. Let's see where the Price Action takes us, Riding the wave. Potential trade setups based on trend momentum.
Technical analysis based on trend identification and momentum, Looking for high-probability setups with

Ultratec Cem Co - BullishStock is stable and looking strong.
Short Term Trader
Entry - 11,589 t0 11,720 range
First Target - 12,582
Second Target - 13,615
Stop Loss - 10,915
Long Term Investor
Entry - CMP to 11,589 range
First Target - 12,582
Second Target - 13,615
Third Target - 14,660
Stop loss - 10,030

See all ideas
Summarizing what the indicators are suggesting.
Neutral
SellBuy
Strong sellStrong buy
Strong sellSellNeutralBuyStrong buy
Neutral
SellBuy
Strong sellStrong buy
Strong sellSellNeutralBuyStrong buy
Neutral
SellBuy
Strong sellStrong buy
Strong sellSellNeutralBuyStrong buy
An aggregate view of professional's ratings.
Neutral
SellBuy
Strong sellStrong buy
Strong sellSellNeutralBuyStrong buy
Neutral
SellBuy
Strong sellStrong buy
Strong sellSellNeutralBuyStrong buy
Neutral
SellBuy
Strong sellStrong buy
Strong sellSellNeutralBuyStrong buy
Displays a symbol's price movements over previous years to identify recurring trends.
UCLQY5127934
UltraTech Cement Limited 2.8% 16-FEB-2031Yield to maturity
5.25%
Maturity date
Feb 16, 2031
See all ULTRACEMCO bonds
Curated watchlists where ULTRACEMCO is featured.

Indian stocks: Racing ahead
46 No. of Symbols
See all sparks
Frequently Asked Questions
The current price of ULTRACEMCO is 12,297.30 INR — it has increased by 0.14% in the past 24 hours. Watch ULTRATECH CEMENT LTD. stock price performance more closely on the chart.
Depending on the exchange, the stock ticker may vary. For instance, on BSE exchange ULTRATECH CEMENT LTD. stocks are traded under the ticker ULTRACEMCO.
ULTRACEMCO stock has risen by 0.56% compared to the previous week, the month change is a −1.03% fall, over the last year ULTRATECH CEMENT LTD. has showed a 6.21% increase.
We've gathered analysts' opinions on ULTRATECH CEMENT LTD. future price: according to them, ULTRACEMCO price has a max estimate of 15,100.00 INR and a min estimate of 7,700.00 INR. Watch ULTRACEMCO chart and read a more detailed ULTRATECH CEMENT LTD. stock forecast: see what analysts think of ULTRATECH CEMENT LTD. and suggest that you do with its stocks.
ULTRACEMCO reached its all-time high on Jul 21, 2025 with the price of 12,711.95 INR, and its all-time low was 250.00 INR and was reached on Nov 25, 2008. View more price dynamics on ULTRACEMCO chart.
See other stocks reaching their highest and lowest prices.
See other stocks reaching their highest and lowest prices.
ULTRACEMCO stock is 1.04% volatile and has beta coefficient of 1.23. Track ULTRATECH CEMENT LTD. stock price on the chart and check out the list of the most volatile stocks — is ULTRATECH CEMENT LTD. there?
Today ULTRATECH CEMENT LTD. has the market capitalization of 3.60 T, it has decreased by −0.40% over the last week.
Yes, you can track ULTRATECH CEMENT LTD. financials in yearly and quarterly reports right on TradingView.
ULTRATECH CEMENT LTD. is going to release the next earnings report on Oct 27, 2025. Keep track of upcoming events with our Earnings Calendar.
ULTRACEMCO earnings for the last quarter are 75.61 INR per share, whereas the estimation was 81.78 INR resulting in a −7.55% surprise. The estimated earnings for the next quarter are 48.89 INR per share. See more details about ULTRATECH CEMENT LTD. earnings.
ULTRATECH CEMENT LTD. revenue for the last quarter amounts to 212.75 B INR, despite the estimated figure of 213.66 B INR. In the next quarter, revenue is expected to reach 192.37 B INR.
ULTRACEMCO net income for the last quarter is 22.26 B INR, while the quarter before that showed 24.82 B INR of net income which accounts for −10.32% change. Track more ULTRATECH CEMENT LTD. financial stats to get the full picture.
Yes, ULTRACEMCO dividends are paid annually. The last dividend per share was 77.50 INR. As of today, Dividend Yield (TTM)% is 0.63%. Tracking ULTRATECH CEMENT LTD. dividends might help you take more informed decisions.
ULTRATECH CEMENT LTD. dividend yield was 0.67% in 2024, and payout ratio reached 37.75%. The year before the numbers were 0.72% and 28.80% correspondingly. See high-dividend stocks and find more opportunities for your portfolio.
As of Aug 5, 2025, the company has 90.17 K employees. See our rating of the largest employees — is ULTRATECH CEMENT LTD. on this list?
EBITDA measures a company's operating performance, its growth signifies an improvement in the efficiency of a company. ULTRATECH CEMENT LTD. EBITDA is 139.34 B INR, and current EBITDA margin is 15.55%. See more stats in ULTRATECH CEMENT LTD. financial statements.
Like other stocks, ULTRACEMCO shares are traded on stock exchanges, e.g. Nasdaq, Nyse, Euronext, and the easiest way to buy them is through an online stock broker. To do this, you need to open an account and follow a broker's procedures, then start trading. You can trade ULTRATECH CEMENT LTD. stock right from TradingView charts — choose your broker and connect to your account.
Investing in stocks requires a comprehensive research: you should carefully study all the available data, e.g. company's financials, related news, and its technical analysis. So ULTRATECH CEMENT LTD. technincal analysis shows the buy rating today, and its 1 week rating is buy. Since market conditions are prone to changes, it's worth looking a bit further into the future — according to the 1 month rating ULTRATECH CEMENT LTD. stock shows the buy signal. See more of ULTRATECH CEMENT LTD. technicals for a more comprehensive analysis.
If you're still not sure, try looking for inspiration in our curated watchlists.
If you're still not sure, try looking for inspiration in our curated watchlists.