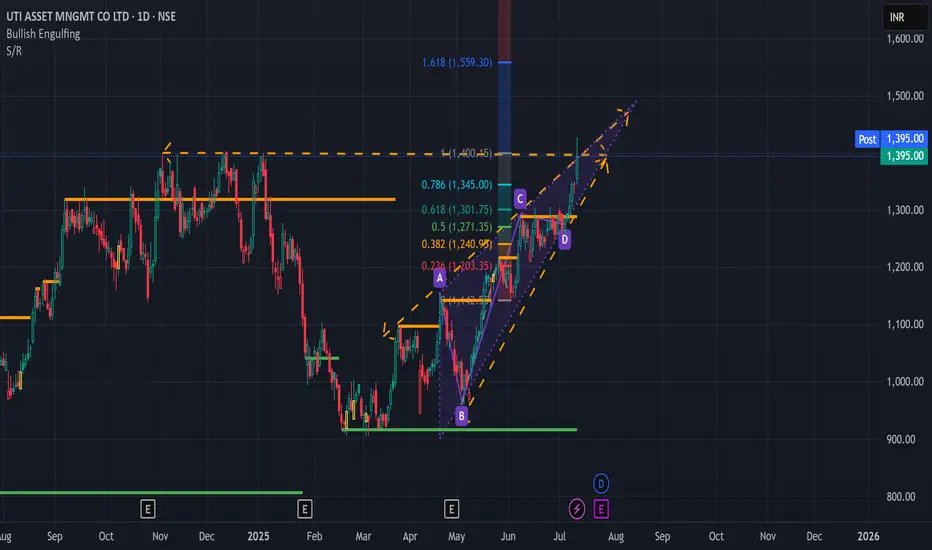
UTIAMC in Multi Month BreakoutNSE:UTIAMC in Multi Month Breakout. You can enter at current Point. 1st target would be 1500 and with Trailing stop loss we can make a Second target of 1550.
UTIAMC trade ideas
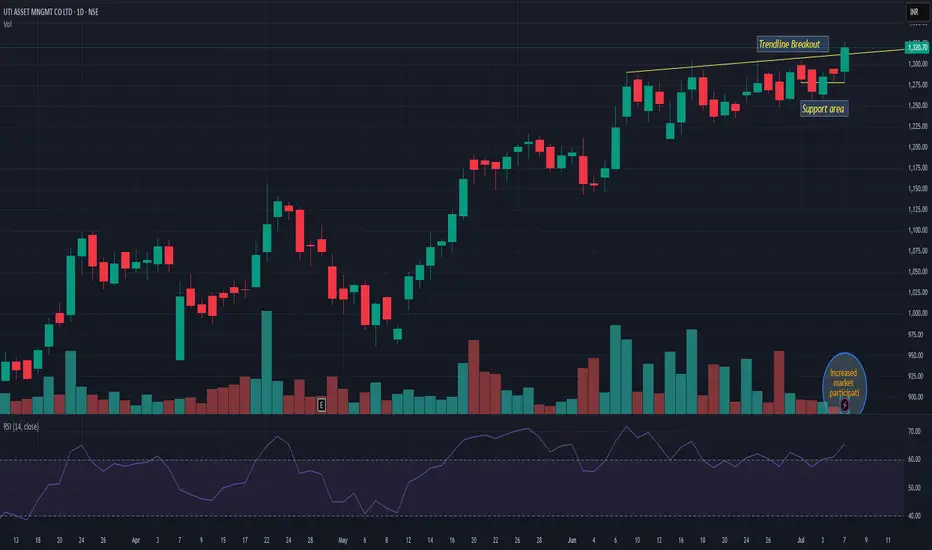
UTIAMCUTIAMC giving trend-line breakout with increased volume. It is trending just 5=7% away from ATH. 1250 seems strong support and on upper side it may trade above 12-15%. Keep it on radar
UTIAMCNSE:UTIAMC
One Can Enter Now ! Or Wait for Retest of the Trendline (BO) Or wait For better R:R ratio
Note :
1.One Can Go long with a Strict SL below the Trendline or Swing Low of Daily Candle.
2. Close, should be good and Clean.
3. R:R ratio should be 1 :2 minimum
4. Plan as per your RISK appetite
Disclaimer : You are responsible for your Profits and loss, Shared for Educational purpose

Value Buy. Monthly Breakout and RetestDouble Digit ROE and ROCE
PEG Ratio ~1
PE in buy zone
DII holdings increased in last quarter
EPS continuously increasing since last 6 quarters
Technical:
Monthly levels: Price retesting the earlier resistance and now support. From a long term perspective huge potential.
Note: Not SEBI registered. Not a buy/sell recommendation. Only sharing my analysis.

UTI ASSET MNGMT CO LTD SLRSupport and Resistance Levels:
Support Levels: These are price points (green line/shade) where a downward trend may be halted due to a concentration of buying interest. Imagine them as a safety net where buyers step in, preventing further decline.
Resistance Levels: Conversely, resistance levels (red line/shade) are where upward trends might stall due to increased selling interest. They act like a ceiling where sellers come in to push prices down.
Breakouts:
Bullish Breakout: When the price moves above resistance, it often indicates strong buying interest and the potential for a continued uptrend. Traders may view this as a signal to buy or hold.
Bearish Breakout: When the price falls below support, it can signal strong selling interest and the potential for a continued downtrend. Traders might see this as a cue to sell or avoid buying.
20 EMA (Exponential Moving Average):
Above 20 EMA(50 EMA): If the stock price is above the 20 EMA, it suggests a potential uptrend or bullish momentum.
Below 20 EMA: If the stock price is below the 20 EMA, it indicates a potential downtrend or bearish momentum.
Trendline: A trendline is a straight line drawn on a chart to represent the general direction of a data point set.
Uptrend Line: Drawn by connecting the lows in an upward trend. Indicates that the price is moving higher over time. Acts as a support level, where prices tend to bounce upward.
Downtrend Line: Drawn by connecting the highs in a downward trend. Indicates that the price is moving lower over time. It acts as a resistance level, where prices tend to drop.
RSI: RSI readings greater than the 70 level are overbought territory, and RSI readings lower than the 30 level are considered oversold territory.
Combining RSI with Support and Resistance:
Support Level: This is a price level where a stock tends to find buying interest, preventing it from falling further. If RSI is showing an oversold condition (below 30) and the price is near or at a strong support level, it could be a good buy signal.
Resistance Level: This is a price level where a stock tends to find selling interest, preventing it from rising further. If RSI is showing an overbought condition (above 70) and the price is near or at a strong resistance level, it could be a signal to sell or short the asset.

UTIAMC LongMy Template Suggesting me that: This Company is Going to Give a breakout, U can Enter Early; after 1310 Closing(weekly)
and the Left Table is Telling me: All the Fundamentals are Strong and Company is Generating Good Return Against major Indices or Commodities (in Weekly Chart)..
The Right Table is Giving me Target of 1485-90 after Breakout+Closing..

#UTIAMC, Multi-Year Breakout#UTIAMC, A Multi-Year Breakout candidate, followed by a neat Pull-back and reassuring bounce on the back of high volumes.

UTIAMCUTI ASSET MNGMT CO LTD Has breakout 3 years resistance breakout
and retest that level TGT up to 1600
this is just for educational purpose only

LONGUTI AMC is a cheapest AMC , cup break out done, may retest . current PE 19.6 PEG ratio 1.15. Good reserves. safe bet at current price/average if retest the support line.

UTI makes fresh all time high after 4 years! UTI Asset Management Company has made a new all-time high after consolidating for 4 years!

UTIAMC Rounding BottomUTIAMC has completed rounding bottom on weekly chart. currently in supply zone.
If the stock sustains above 1220, a good move towards 1500 is expected.

UTI Asset Management Company Ltd about to break all time high!!UTI Asset Management Company Ltd about to break all time high. Trade accordingly with proper risk management and Trade management.

UTI AMC - Ifs and Buts !!UTI AMC is currently displaying a symmetric triangle formation on its weekly chart. Recently, it formed a double bottom pattern on the weekly timeframe, which was followed by a breakout. The stock is currently encountering a minor resistance level. Interestingly, the resistance trend channel and the 50% Fibonacci retracement level align closely, making it a strong barrier for further upward momentum.
Given the circumstances, if UTI AMC consolidates within this resistance zone before continuing its upward trajectory, it has the potential for significant momentum.
Disclaimer: Please note that we are not registered advisors and the views expressed here are solely personal opinions. We strongly recommend consulting with your financial advisors before making any investment decisions. We like everybody else, have the right to be wrong.:)

mutaul fundnow in India, the mutual fund industry is getting inflow
retail investors are more active in SIP so mutual fund house are in good condition.
This fund can take advantage of this.
FII's increase in stake from 5.97% to 6.27
The number of share houlders decreases, which is also a positive hand.

UTI AMC BULLISH ON SHORT AND LONG TERMEntry at 725
Short term target 764
6 months target 865Rs
Top growing stock.
Invest for good returns


Bullish Momentum: UTI AMC Eyeing New Highs🚀 UTI AMC shows promising signs of a bullish run, poised for new highs!
📈 Strong fundamentals, positive market sentiment, and potential catalysts in play.
💡 Dive into the charts and join me in exploring the upward trajectory.
🔍 Not financial advice, just sharing my optimistic outlook. Do your research!

UTI AMC Taken a Reversal from Importent Level 853 we can see 973UTI AMC Taken a Reversal from Important Level 853 we can see 973 in Coming days

UTI Asset Management Weekly Timeframe analysis for long term
NSE:UTIAMC has given trendline breakout and about to break major resistance 867.
We can see long term move above 867 & can buy more till 800 with SL 780.
Major targets levels are highlighted in blue lines.

UtiamcStock name = Uti Asset Management Company Limited.
Daily chart setup
Chart is self explanatory. Levels of breakout, possible up-moves (where stock may find resistances) and support (close below which, setup will be invalidated) are clearly defined.
Disclaimer: This is for demonstration and educational purpose only. this is not buying and selling recommendations. I am not SEBI registered. please consult your financial advisor before taking any trade.

Nearing BreakoutBuy above the resistance zone
Targets are mention in the chart
Always uses stop loss.
Buy on your own risk.😊


UTIAMC looking for an buy UTIAMC looking for an buy. becoz, there is an ob and also created a strong liqudity too.
