Voltas can be a high voltage high PE long term investment idea.Voltas Ltd. CMP – 843.65
Market Capitalization Rs 27,915.1Cr
Red Flags:🟥
High Valuation (P.E. = 139.9)
Declining cash from operations annual
FIIs are decreasing stake
Green Flags:🟩
No debt
Zero promoter pledge
MFs are increasing stake
Improving annual net profit
Previous Happy Candles Number – 41/100
New Happy Candles Number – 41/100
Fresh Entry/ averaging / compounding after closing above 854
Targets:872 and 888
Long term target: 902 and 915
Stop loss: Closing below 800
The above information is provided for educational purpose, analysis and paper trading only. Please don't treat this as a buy or sell recommendation for the stock. We do not guarantee any success in highly volatile market or otherwise. Stock market investment is subject to market risks which include global and regional risks. We will not be responsible for any Profit or loss that may occur due to any financial decision taken based on any data provided in this message.
VOLTAS trade ideas


Voltas share Long Voltas share daily time period complete wave 1 upside
wave 1 internal 1,2,3,4,5
and wave 2 come down 62% Wave 1
wave 2 internal a,b or c
Wave 3 side upside . Wave 3 target 1.68% wave 1 mean cross wave 1 high
Wave 2 internal 0-b trendline not breakout . but Wave C internal 1,2,3,4or 5 downside 2 or 4 trendline breakout

Voltas - Elliott Wave CountVoltas - Elliott Wave Count
It appears that the market correction for Voltas has come to an end, and we can anticipate another upward impulse wave, provided that today's low remains stable. Anyone who opened a short position based on our previous view should consider closing it. However, if the market falls below the current low, the previously mentioned view will no longer be applicable.
Please note that this information is for educational purposes only, and it is crucial to trade with caution.
NSE:VOLTAS NSE:VOLTAS1! BSE:VOLTAS

Voltas - Elliott Wave CountVoltas - Elliott Wave Count
Voltas - The market appears to be in correction. it seems that Wave B is completed so the price is expected to decline with wave C. wave c target 830 to 825 range and consider 888 level for invalidation to this view.
Once the ABC correction is completed we can expect the next impulse up move.
Please note that this information is for educational purposes only, and it is crucial to trade with caution.
NSE:VOLTAS NSE:VOLTAS1! BSE:VOLTAS BSE:VOLTAS

Voltas Mid Term View - Double BottomVoltas is reversing from the 61.8% Fibonacci Retracement levels of the previous swing in Monthly Timeframe with a Double Bottom and Bullish RSI Divergence which is a very Bullish pattern.
Daily timeframe shows a price compression too.
Once the Monthly candle crosses above the Trendline, can look for the marked SUPPLY LEVELS as target levels. Bottom fishing with small SL!

VOLTAS is about to give BREAKOUT! Don't miss this!!!!It's time to BUY VOLTAS. Wait for the weekly close above 913. Immediate targets will be 1051 (15% upside) and 1317 (44% upside). within 4-6 months you can gain up to 44%.
All of my given trades have been 100% successful. Don't you believe it? Check my all published charts!
Please comment if you have any queries.


We are heading Back to 1300. Breaking the trend line channel . Important to see, if it can continue the momentum.
If it does....then its 1300 is surely ONNN


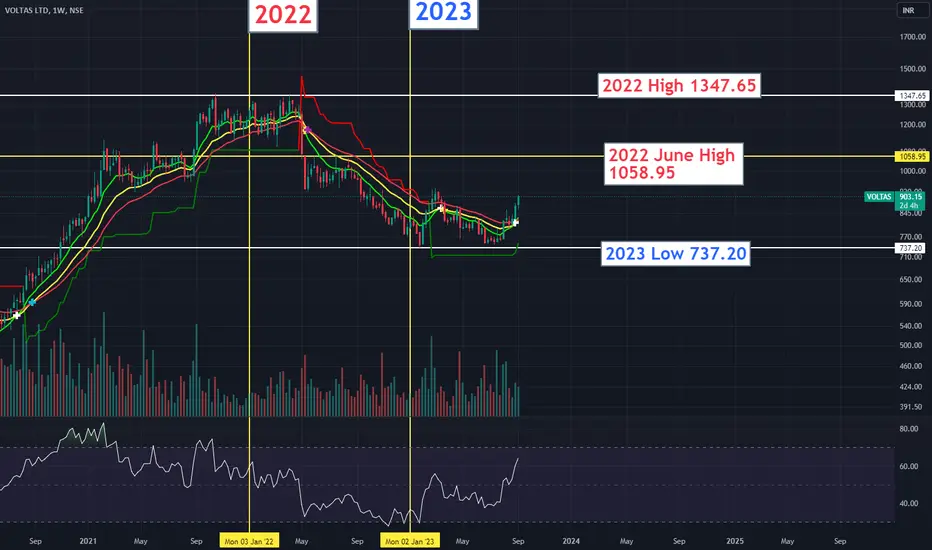
VoltasVoltas is bouncing form 2023 Years Low an now approaching 2022 June month high...
If it Break 2022 June High price level we could see 2022 year high price level
Voltas : Above 820 - may reach 840-50-70Voltas appears to be positioning itself well above the 820 levels, with several attempts to surpass the 814-815 rs limit. If this level is crossed, there is a high chance that the stock may reach the 840-50-70rs mark.
The statement is meant solely for educational purposes and should not be taken as a recommendation.

My view on VoltasVoltas trendline breakout
Above 870-871
Tgt 880-890-900+++
Very short term
Keeping on radar Voltas 880 CE

VOLTAS LONGGood chart pattern
After a long time trend line breakout
Price above tha DEMA
Volume also support.
Macd bullish crossover
Disclaimer this is my personal view for education purpose only.

Voltas In the Buying ZoneVoltas doing pretty bad for quite a long time. But it seems we are in the fair prices buying zone with some divergence. It might not rebound fast but should come back with at least 30% in a year time frame.
I will only add 1% of my investment (Rs 10,000) here. There won't be any stoploss and I am ready to forego the whole amount if a disaster happens!
Buying Price: 777.80
Qty: 13
Target: 1015
Disclaimer: Don't follow my trades blindly ! It's only for educational and entertainment purposes

VOLTAS AnalysisAfter forming a base level around the level of 745, VOLTAS showed a strong rising trend till the level of around 820
RSI=70(strong momentum)
ADX=21 and rising (strong rising trend)
Above 50,100 and 200 EMA's only below 20 EMA(839)
Resistance Zone:820-830
Upside Target: 845-850 and 865-870
Support Zone: 745-760
Below this level VOLTAS is weak.

Double bottom Double bottom in Voltas.
Double bottom or W shape recovery can be seen.
Strong support taken now ready to move.
Do your analysis before any decision.

Voltas BuyBroke out of a sloping trendline...long term investment...please read the tgts and Time period on the chart

VoltasAs we can see in chart, Voltas is trying to breakout through the resistance zone. It already broke the trendline. Volume is not as much as good as it should be but still I hope it will go to 840 levels. Lets see. The content provided is for educational and informational purposes only.

VOLTAS 🔥🚀 20% TARGETswing trade perfect symmetrical triangle short term opportunity for upside take trade after breakout from the trendline according to own risk this is not call just a analysis.


Voltas trend reversal now Voltas trend reversal now. Voltas in uptrend swing, open for big target now.

