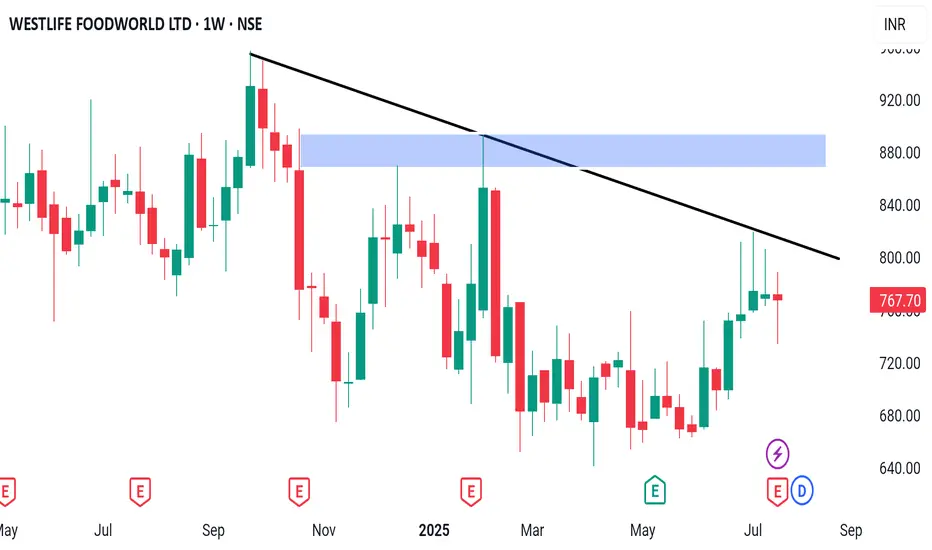
Trendline breakout Looking good pattern for trendline breakout
Main thing may come in liquidity in the stock
Apart from that you can see good structure for trendline breakout
WESTLIFE trade ideas
Westlife forming a classical convergent triangleWestlife is consolidating in a convergent triangle, and might take some time to break down and break out.....There are levels 498 which hasn't been tested yet, but nevertheless, I see 2 scenarios for this stock....with the current market conditions it is possible a breakdown could happen....If you are buying this stock, make sure you get it at the lowest price possible.....I have multiple sell orders till 1000 and above

WESTLIFE FOODWORLD LTD S/RSupport and Resistance Levels:
Support Levels: These are price points (green line/shade) where a downward trend may be halted due to a concentration of buying interest. Imagine them as a safety net where buyers step in, preventing further decline.
Resistance Levels: Conversely, resistance levels (red line/shade) are where upward trends might stall due to increased selling interest. They act like a ceiling where sellers come in to push prices down.
Breakouts:
Bullish Breakout: When the price moves above resistance, it often indicates strong buying interest and the potential for a continued uptrend. Traders may view this as a signal to buy or hold.
Bearish Breakout: When the price falls below support, it can signal strong selling interest and the potential for a continued downtrend. Traders might see this as a cue to sell or avoid buying.
20 EMA (Exponential Moving Average):
Above 20 EMA(50 EMA): If the stock price is above the 20 EMA, it suggests a potential uptrend or bullish momentum.
Below 20 EMA: If the stock price is below the 20 EMA, it indicates a potential downtrend or bearish momentum.
Trendline: A trendline is a straight line drawn on a chart to represent the general direction of a data point set.
Uptrend Line: Drawn by connecting the lows in an upward trend. Indicates that the price is moving higher over time. Acts as a support level, where prices tend to bounce upward.
Downtrend Line: Drawn by connecting the highs in a downward trend. Indicates that the price is moving lower over time. It acts as a resistance level, where prices tend to drop.
Disclaimer:
I am not a SEBI registered. The information provided here is for learning purposes only and should not be interpreted as financial advice. Consider the broader market context and consult with a qualified financial advisor before making investment decisions.

WESTLIFE FOOD WORLD LTD WEEKLY ANALYSIS The Stock Has Given Breakout Of 1 year Range and Now Ready For Massive Upmove. Can head Towards 1200-1400 Levels..One can Make And Manage Position According given Levels..

Key Support / Resistance Breakout - Swing TradeDisclaimer: I am not a Sebi registered adviser.
This Idea is publish purely for educational purpose only before investing in any stocks please take advise from your financial adviser.
Key Support & Resistance Breakout. Stock has give Breakout of Resistance level. Keep in watch list. Buy above the high. Suitable for Swing Trade. Stop loss & Target Shown on Chart.
Be Discipline because discipline is the Key to Success in the STOCK Market.
Trade What you see not what you Think.

WESTLIFE FOOD, will make it or break it-Keep watching:)WESTLIFE FOOD can double from here with in few years. Sl below the trend line.
Chart is self explanatory. Please follow the price action & take the trade as per your appetite.
The information provided here is only for educational purpose. The information provided here is not intended to be any kind of financial advice, investment advice, and trading advice. Investment in stock market is very risky and trading stocks, options and other securities involve risk. The risk of loss in stock market can be substantial. Moreover, I am not a SEBI registered analyst, so before taking any decision or before investing in any Share consult your financial advisor and also do your analysis and research.
Request your support and engagement by liking and commenting & follow to provide encouragement.

Ready to Roar for 929-970-1000+ Very promising set up ... correct cycle seems over once cross 928 with volume ready to roar for 1000+ in few session... Short term SL weekly close below 710 positional sl 675 weekly close below. Till than buy on dip counter avoid noise... Believe in chart , it never lies.. Festival Session is coming .. Kuch samje Binod ??
K.N. :- Its for educational purpose.

#WESTLIFE Stock looks amazing at current levels.
Stock looks good for upside at current levels. S/R zone (in blue) tapped; this zone has acted as a good resistance zone earlier and now should act as a good support zone.
Also price has moved back inside the range (marked in orange).
I see good upside in stock in coming days.

correction seems end WESTLIFE ready to up Short term SL 770 Weekly close below for 845-865-925.. If horizon 3-4 months.
If want to add this GEM for above 1 year then put SL for 670 weekly close below for 925 if sustain above 930 then ready to reach 965-1018-1140....
K.N.: Before taking position kindly go through chart and take advise from your financial planner.. I am not registered SEBI advisor.

Westlife Development looking very bullish.Westlife Development looking very bullish for about next month. Someone can easily expect target of a round number ₹1000 only once it gave us breakout of an important trendline. With a Risk Reward of around 1:3.9.

WESTLIFE DEVELOPMENT DAILY CANDLE CHARTWESTLIFE DEVELOPMENT now breaks the previous resistance and forms W pattern ,so will expect 1000+ in midterm and keep Stop loss at 798 Daily candle closing basis (DYOR)

WESTLIFE - Bullish Swing ReversalNSE: WESTLIFE is closing with a bullish swing reversal candle supported with volumes.
Today's volumes and candlestick formation indicates strong demand and stock should move to previous swing highs in the coming days.
The stock has been moving along the horizontal support for the past few days which is indicating demand.
One can look for a 8% to 12% gain on deployed capital in this swing trade.
The view is to be discarded in the event of the stock breaking previous swing low.
#NSEindia #Trading #StockMarketindia #Tradingview #SwingTrade
Disclaimer:
This is for educational purposes only.

Westlife Development Daily Chart*Everything is mentioned on the chart. I hope it is easy to understand.
*Don't jump in to trade at the beginning of the market. let it get settle for 5 min 15MIN first and judge price action.
*Avoid gap up or gap down chase. Wait and trade between level.
Note: Trade with strict stoploss. It may or may not hit all the levels. So one can book profit / loss at respective level considering
how price action work near that level. Always follow your trading plan regarding entry, risk management, and trade management.
Good luck!
All Strategies Are Good; If Managed Properly!
#stockmarket #stocks #investing #trading #investment #money #finance #forex #invest #nifty #investor #business #sharemarket #financialfreedom #bitcoin #trader #cryptocurrency #entrepreneur #sensex #daytrader #stock #wallstreet #wealth #nse #forextrader #bse #stockmarketindia #daytrading #stockmarketnews #forextrading

WestLife long tradeWestlife is giving consolidation breakout after long time. Must buy at present levels.

Westlife Dev ReversalThe stock has reached lower trendline and may undergo a reversal rally. Trade is supported by brokerage calls and Supports Nearby.
Risk Reward Ratio - 3:1
SL is placed below support zone & the lower trendline. The target is placed based on fundamentals.
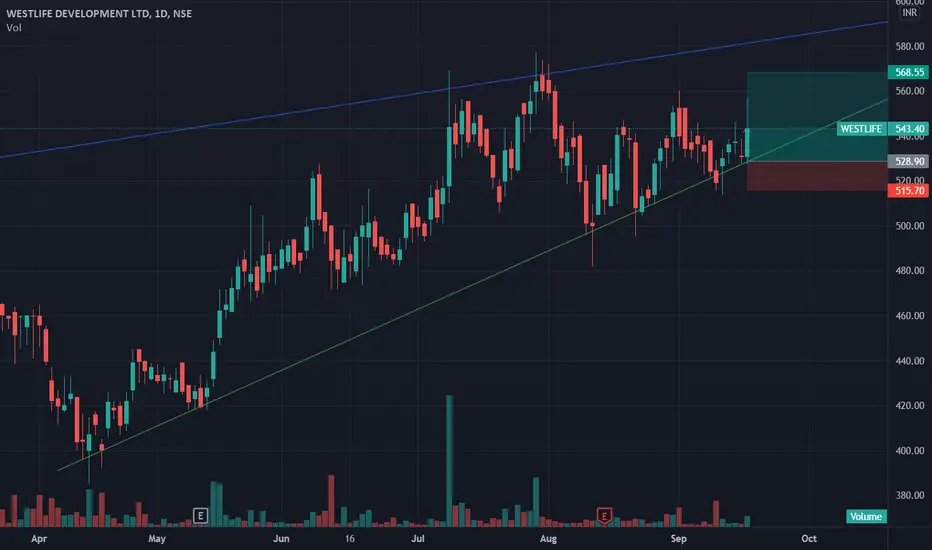


BREAKOUT in WESTLIFEit ran from 525 to 565 while editing the chart :)
Clear breakout in WESTLIFE
Disclaimer - This is just for educational purpose and not a trading or investment advise


