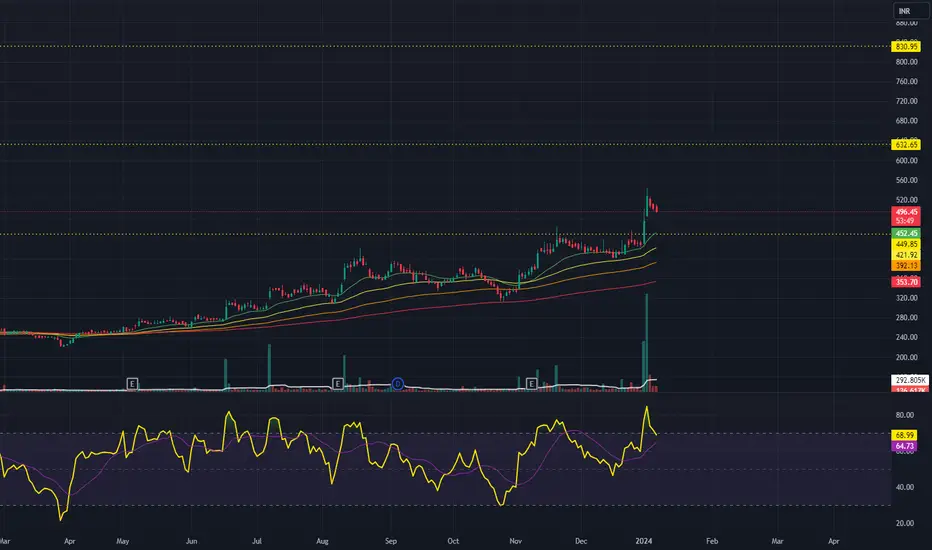
WINDLAS BIOTECH LTD S/RSupport and Resistance Levels:
Support Levels: These are price points (green line/shade) where a downward trend may be halted due to a concentration of buying interest. Imagine them as a safety net where buyers step in, preventing further decline.
Resistance Levels: Conversely, resistance levels (red line/shade) are where upward trends might stall due to increased selling interest. They act like a ceiling where sellers come in to push prices down.
Breakouts:
Bullish Breakout: When the price moves above resistance, it often indicates strong buying interest and the potential for a continued uptrend. Traders may view this as a signal to buy or hold.
Bearish Breakout: When the price falls below support, it can signal strong selling interest and the potential for a continued downtrend. Traders might see this as a cue to sell or avoid buying.
MA Ribbon (EMA 20, EMA 50, EMA 100, EMA 200) :
Above EMA: If the stock price is above the EMA, it suggests a potential uptrend or bullish momentum.
Below EMA: If the stock price is below the EMA, it indicates a potential downtrend or bearish momentum.
Trendline: A trendline is a straight line drawn on a chart to represent the general direction of a data point set.
Uptrend Line: Drawn by connecting the lows in an upward trend. Indicates that the price is moving higher over time. Acts as a support level, where prices tend to bounce upward.
Downtrend Line: Drawn by connecting the highs in a downward trend. Indicates that the price is moving lower over time. It acts as a resistance level, where prices tend to drop.
Disclaimer:
I am not a SEBI registered. The information provided here is for learning purposes only and should not be interpreted as financial advice. Consider the broader market context and consult with a qualified financial advisor before making investment decisions.
WINDLAS trade ideas

Windlas Biotech LtdIt may retest 525 - buy in 2 parts now and on retest zone
SL - as per your appetite
FUNDAMENTALS
Market Cap
₹ 1,149 Cr.
Current Price
₹ 552
High / Low
₹ 591 / 221
Stock P/E
21.8
Book Value
₹ 200
Dividend Yield
0.74 %
ROCE
14.1 %
ROE
10.5 %
Face Value
₹ 5.00
Price to book value
2.76
Intrinsic Value
₹ 356
PEG Ratio
0.72
Price to Sales
1.91
Debt
₹ 6.31 Cr.
Debt to equity
0.02
Int Coverage
69.8
Reserves
₹ 406 Cr.
Promoter holding
62.8 %
Pledged percentage
0.00 %
EPS last year
₹ 20.0
Net CF
₹ 3.12 Cr.
Price to Cash Flow
18.8
Free Cash Flow
₹ -9.01 Cr.
OPM last year
11.7 %
Return on assets
8.23 %
Industry PE
30.7
Sales growth
21.4 %

50 SMA Rising- Positional TradeDisclaimer: I am not a Sebi registered adviser.
This Idea is publish purely for educational purpose only before investing in any stocks please take advise from your financial adviser.
Its 50 SMA Rising Strategy. Suitable for Positional Trading Initial Stop loss lowest of last 2 candles and keep trailing with 50 days SMA if price close below 50 SMA then Exit or be in the trade some time trade can go for several months.
Be Discipline because discipline is the Key to Success in the STOCK Market.
Trade What you see not what you Think

Windlas biotech will fly more Take entry at 363
Target 451
Next average at 299
Counter will try to catch it's life high then breakout it also.
So first target will be 451 and then if close above 475 then next major target will be 850
Be invested with very good Q 1 result


WINDLASAfter accumulation phase it is going up. very gud rounding bottom pattern. it may go to its all time high. supported by gud volume on green elephant candle. all key MA are working as a support. it may be gud buy on retracement. it may have a gud target in near future.

Windlas Biotech LtdWindlas Biotech Ltd is a leading domestic pharmaceutical formulations contract development and manufacturing organization (CDMO). The company manufactures both solid and liquid pharmaceutical dosage forms and provides a comprehensive range of CDMO services ranging from product discovery, product development, and commercial manufacturing of generic products, including complex generics.
IPO Round Bottom BreakoutThe Stock broke out round bottom base after 30 weeks with huge volume and the stock has back-to-back movement showing the strength in the stock.
Time to look at this stock.

Windlas Biotech-Nice breakout.Windlas Biotech-Nice breakout.
Capital to be deployed- 20k
Investing Price -310-315
Breakout Price -299
Stoploss-270
Targets-382-483
#windlasbiotech #StockMarket #StockMarketindia #stockmarkets #StocksToBuy #stockmarketcrash #StockToWatch #StocksInFocus #stockmarketnews

WindlasEducational purpose only
Buy once green candle closes above support line on Daily time frame
Swing trading opportunity

