Wipro Ascending on Support of Trend Line, Possible breakout Wipro is Ascending on 4H TF , if wipro trade below the trendline then we can enter for short Entry Here.
WIPRO trade ideas

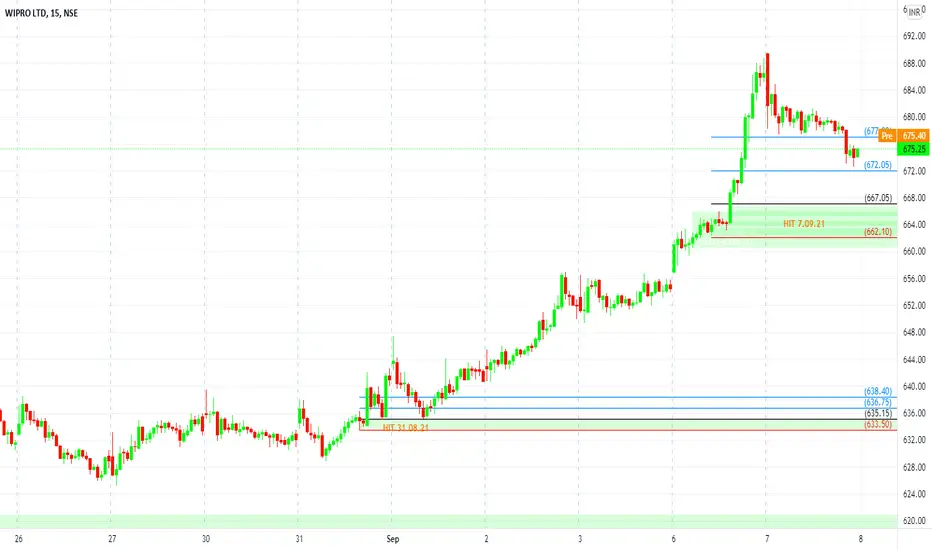
Wipro Price Action Breakout @673 Wipro Price Action Breakout @673 If it sustains it will be a Big move
Note: For Educational Purpose Only..!

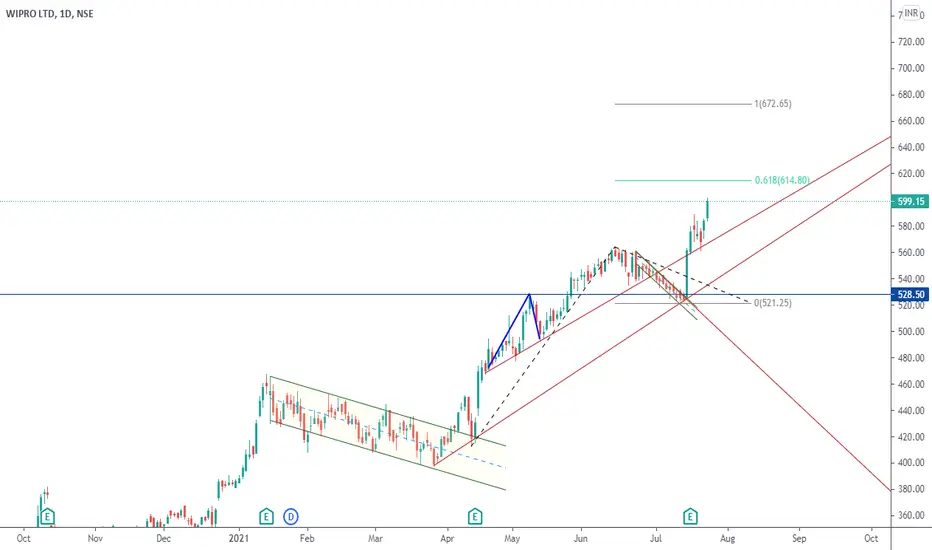
WIPRO broadening-wedges-ascendingHello
Welcome to this analysis about WIPRO , we are looking at daily timeframe perspectives. WIPRO is developing here that will be a decisive factor in the upcoming times. I discovered the main formation WIPRO is developing here that will be a decisive factor in the upcoming times. As when looking at my chart now we can watch there how WIPRO has emerged with this key broadening-wedges-ascending formation marked in my chart with the black boundaries. WIPRO is near RESISTANCE region which is an important support and also psychological support-mark together with the lower
boundary of the broadening-wedges-ascending formation a pullback
In this manner, thank you for watching my update-analysis about WIPRO and its major broadening-wedges-ascending-formation with the determining factors we need to consider in upcoming times, support the analysis with a like and follow or comment for more market insight!

WIPRO 15 MIN as on 05.09.2021A SHORT SYMMETRICAL TRIANGLE FORMED !!
Wait for Breakout and a move a good call for intraday!!
AND A BIG DESCENDING TRIANGLE WAS FORMED FROM 16 AUG AND CLOSE TO HIT TARGET!!
So high probability of hitting target!!!!
Daily basis demand and supply can give good support for a move!!
And do check pivot points for intraday!!!
TARGET=606/608
STOP LOSS=650/648
(Do not take it as any buy or sell call)

wipro buyWipro Buy based on the chart pattern
Ascending Triangle pattern
Entry 662
S l 642
Target 700
Disclmar :- the above is shared just for educational purpose and is my personal view . by no means shall i be accountable for any loss,
I am not a SEBI registered analyst, So please consult your investment Advisor and take rational decisions


WIPRO 15 MIN as on 01.09.2021ASCENDING TRIANGLE PATTERN FORMED!!
Too many fake breakouts but Gave again one breakout!!
Taking a pull back and can move again!!
Do check volume!!
Target= 666.25/670
Stop Loss=635/630
200 EMA GIVING A GOOD SUPPORT!
(The above analysis is only for study purpose do not take it as any buy or sell call!!)

WIPRO - Clean breakoutWe have a clean breakout today accompanied by good volume.
All the supply has been absorbed inside the channel.
Should post a good move from here.


Wipro at 635rs... target...?? Wipro has entered zone of 630plus where the target has increased to 760plus.. its 20% upside... every dip must be used for accumulation...

WIPRO LONG INTRADAY 26 AUG,2021Dear trader,
If u look at the chart of WIPRO (analysis based intraday only) the WIPRO Buy at 632 and Target at 644
Best Buy at 630
Our Best Buy is based on high quality research and when the instrument reaches this level , it’s a jackpot trade.
Best Buy level might be executed or might not be executed.
The chart clearly indicates Bullish Trend you can also see the candle stick patters for more indepth analysis.
In Intraday most important thing is to enter and exit points.
Our signals are based on analytics, algorithms, mathematical derivatives.
Always be a responsible trader, kindly trade only when you have maximum opportunity in the market with minimum risk and with keynotes like data, analysis and proper strategies.
Kindly message us for strategies and analysis.

WIPRO as on 24.08.2021A FALLING WEDGE PATTERN BEING FORMED IN 15 MIN CHART!!
A PARLLEL PATTERN BEING FORMED IN 1 DAY CHART!!
A good call for intraday if candle breaks up then will retest and move to its resistance level that is off 644!!
And if candle retest then can come up to its support level which was generated with gap up opening that is off 630!!
Their will be the risky trade zone in between the pattern because of support!!
Wait for breakout in any direction for good call and do check volume and retesting value!!
(THE ABOVE ANALYSIS IS ONLY FOR STUDY PURPOSE DO NOT TAKE IT AS ANY BUY OR SELL CALL!!)

Support and resistance trading Wipro was bouncing between a strong support and resistance. After the breakout bought at the pull back .
Huge moment after the pull back .

Wipro target 920...Wipro likely to reach 920... now at 635rs.... jus had breakout... so sure will reach 920

wipro bullish long termlong term invest ment bullish.
it is in channel until it touches the top trend line it is bullish.. for august after that it will be in correction.. and then again up movement

WIPRO SEEING A FLAG SHAPE ON 15 MINUTE CHART AFTER CORRECTION ON WIPRO IT MAKES A FLAG SHAPE ON 15 MINUTE CHART AS WE SEE ON THIS CHART IT MAKE HIGH OR RESISTANCE LEVEL AT 590 AND MAKE ALL TIME HIGH AT 601 WITH LOW 583 . SO, WE CAN TAKE AN OPPORTUINTY TO MAKE POSITION ON WIPRO ABOVE 590 WITH A STOP LOSS 580 FOR THE TGT OF 600 IMMEDIATELY .


Wipro trendline break and support betCan go long on wipro once it crosses its day's high. simple price action

WIPRO | PositionalWipro has been on a bull run since the last two months, however the stock is now retracing for the last couple of weeks. The stock is now at a 50 MA position and it seems to be respecting the 50 MA for a long time. The RSI is in the oversold zone and MACD has started fading its negative momentum. The stock is taking support at 23% retracement.
Expecting the continuation of bull run in the coming days.
Idea - Positional
CMP- 526
Target - Next 50 MA crossover
SL - 513
Sharing for educational purpose only.

