WIPRO trade ideas
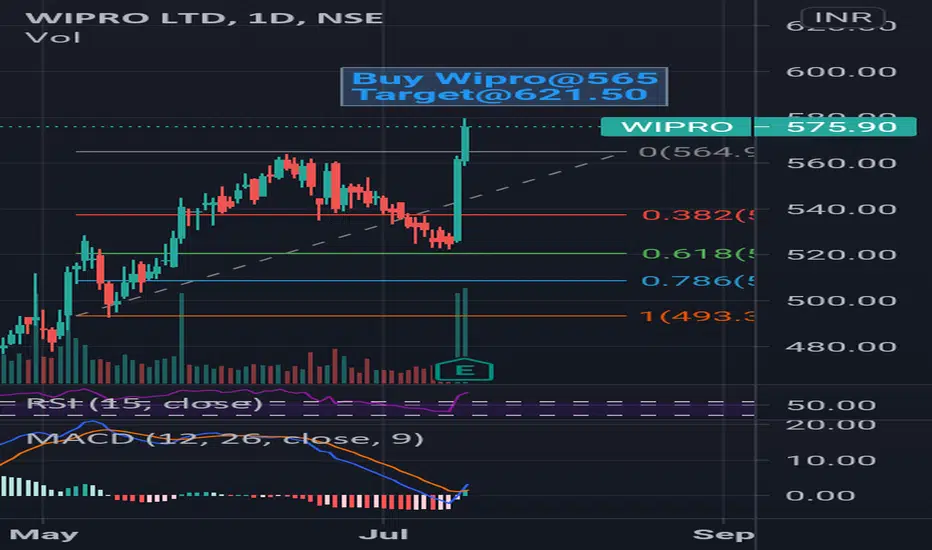

trade idea No 1. WIPROwipro probable end of correction.
horizantal line is support.
first vertical line day of buying.
second vertical line minimum holding period once above 543 or time stop if doesnt manage above 543.

Might reach till 620 to 670 by trend analysis I have used the trend analysis of the upward trend and felt like it would reach 620 or it can have a resistance at 560 which might get it into a consolidation stage.
But its highly unlikely as they are releasing their Q3 results tomorrow which is why the stocks are continuously rising.
As, its a software company and because of the pandemic software will keep growing as people have realized the importance of it.
All analysis done by me are just ideas which cannot guarantee you results and these are just ideas.
Please do not completely rely on my analysis and I suggest you to do your own analysis for better results.
Thank you !


WIPRO watch out and go looooooooongAlas !!!!!!!!!!!!! Third tech stock similar to TECHM and HCLTCH analysis. It appears that tech stock following specific trend!
Wipro completed Elliott corrective wave and begin new cycle of Impulse wave! Got good support at Fibonacci retracement level of 0.236 (410 ) .
watch out for breakout above triangle line.
If price moves above triangle, I will update T1 and T2.
If you are long time investor, cash out after 5 months (approximate time for completing New impulsive wave ).

Wipro may ConsolidateThere are chances for a bearish consolidation till mid August. A bounce back can be expected from 520 range

WIPRO BEARISH SIGNALHello Trader I Found WIPRO in Bearish Mode as we see there it formed Ascending channel In 1 HRS Time Frame it will come to its Supports Trendline. Please do your own analysis before taking any action if you find my analysis is useful for you please follow me and like me. Thank You


WIPRO ::: BULLISHDATE: 18 MAY 2021
INSTRUMENT: WIPRO
TREND: BUY
TIME FRAME: DAY
CMP: 508.05
BUY ABOVE: 515
STOP LOSS: 505
TGT 01: 524
TGT 02: 560
DISCLAIMER:
We are not S E B I registered analysts. Please consult your personal financial advisor before investing. We are not responsible for your profits/losses whatsoever.
Leave a comment that is helpful or encouraging. Let's master the markets together.


WiproA clear direction ⬆️ 590-600.but market can't go straight up or down.must need accumulate or distribution. Its fall hudge when drop.keep your sl always trials.


Beauty of PatternsThis is an Educational post.
*Trade Confirmations*
:- Breakout in daily time frame has a lower chances to fail.
:- A green candle has broken the trendline
:- Huge volume near trendline that acted as amazing support.
:- Good quarterly results.
*When to Buy*
:- Enter with half quantity after the trend line is broken.
:- Add the rest of quantity when the price is near the support/trendline/retest region.
:- This retesting region is a key level where many traders will start to buy resulting in a huge volume.
*When to Sell*
:- The gap between the 2 trendlines is calculated as the target zone.
*Some more points*
:- Triangle is not only the pattern out there. There are lots of patterns that are good too.
:- I personally like triangle patterns.
:- So, I'm posting the educational idea to let everyone know the power of patterns.
:- Remember there are a lot of people who see the same chart. So many many might have done the same analysis. that results in everyone buying the stock which will raise
the price
Why I like the Trading View Community ?
There are 1000s of stocks out there. Even a full time trader can't look at them all.
That's where the community plays an important role. There are many curious and intelligent minds out there who post ideas based on charts that helps other people to look at the chart.
So the 1000 companies or more can be easily scanned that saves a huge time.
However don't copy the analysis. With the stock name, open the chart yourself and draw the patterns to find key levels to enter and exit
Don't forget to plan the number of quantities that you'll take.
Plan everything before entering the trade
This is just my personal view on their community.
That's it. Congrats if you have read everything. You really are a curious and patient person because a person could be judged by the amount of patience they have while reading.
Follow me so that you'll get notified whenever I post some content.
All the best!

#WIPRO wipro - Double Inside bar formed in daily.
take trade buy/ sell once crosses high / low of mother bar respectively.
Modified pitchfork used

WIPRO Reversal SignAfter recording All-Time High WIPRO looks set for some correction.
SELL Below 528
TARGET : 480/471/457
STOP LOSS : 543

Symmetrical patternCan be trader for intraday and short term. Enter after the breakout. Good pattern forming in daily time frame.


WIPRO, D : BULLISHAS ON 27TH MARCH THE VOLUME WAS AROUND 30MILLION BECAUSE OF DEVELOPMENT NEWS IN IT SECTOR.
ACCORDING TO ME , MY NEXT TARGET WILL BE
550-555-565

WIPRO - BULLISHDATE: 18 MAY 2021
INSTRUMENT: WIPRO
TREND: BUY
TIME FRAME: DAY
CMP: 508.05
BUY ABOVE: 515
STOP LOSS: 505
TGT 01: 526
DISCLAIMER:
We are not S E B I registered analysts. Please consult your personal financial advisor before investing. We are not responsible for your profits/losses whatsoever.


