WPIL S/RSupport and Resistance Levels:
Support Levels: These are price points (green line/shade) where a downward trend may be halted due to a concentration of buying interest. Imagine them as a safety net where buyers step in, preventing further decline.
Resistance Levels: Conversely, resistance levels (red line/shade) are where upward trends might stall due to increased selling interest. They act like a ceiling where sellers come in to push prices down.
Breakouts:
Bullish Breakout: When the price moves above resistance, it often indicates strong buying interest and the potential for a continued uptrend. Traders may view this as a signal to buy or hold.
Bearish Breakout: When the price falls below support, it can signal strong selling interest and the potential for a continued downtrend. Traders might see this as a cue to sell or avoid buying.
20 EMA (Exponential Moving Average):
Above 20 EMA(50 EMA): If the stock price is above the 20 EMA, it suggests a potential uptrend or bullish momentum.
Below 20 EMA: If the stock price is below the 20 EMA, it indicates a potential downtrend or bearish momentum.
Trendline: A trendline is a straight line drawn on a chart to represent the general direction of a data point set.
Uptrend Line: Drawn by connecting the lows in an upward trend. Indicates that the price is moving higher over time. Acts as a support level, where prices tend to bounce upward.
Downtrend Line: Drawn by connecting the highs in a downward trend. Indicates that the price is moving lower over time. It acts as a resistance level, where prices tend to drop.
RSI: RSI readings greater than the 70 level are overbought territory, and RSI readings lower than the 30 level are considered oversold territory.
Combining RSI with Support and Resistance:
Support Level: This is a price level where a stock tends to find buying interest, preventing it from falling further. If RSI is showing an oversold condition (below 30) and the price is near or at a strong support level, it could be a good buy signal.
Resistance Level: This is a price level where a stock tends to find selling interest, preventing it from rising further. If RSI is showing an overbought condition (above 70) and the price is near or at a strong resistance level, it could be a signal to sell or short the asset.
Disclaimer:
I am not a SEBI registered. The information provided here is for learning purposes only and should not be interpreted as financial advice. Consider the broader market context and consult with a qualified financial advisor before making investment decisions.
WPIL trade ideas

WPIL - Pumps industryObverse this interesting stock. Has been hitting back to back lower circuits for 7 trading sessions and started reversing with strong candle hitting upper Cricut today.
In my observation this stock has taken SMA 50 support most of the time also and SMA 200 when it can't pull back. Even though there is no real bad financial results this stock took heavy correction after giving 3x profits in just 1 year.
I got stuck in this stock after making a very very bad entry at the peak :). But I kept it holding and averaged at SMA 50 and SMA 200 and looking for 4800-5000 target with a short term target of 3810.
My reason for holding the position and average on dip would be because of pure technical reasons (RSI, MACD, Volume, Support levels) and strong financials
I don't see any negative reason except that this is a low liquidity stock may not be able to exit at will.

WPIL WPIL Limited.
Showing good signs of profitability & efficiency.
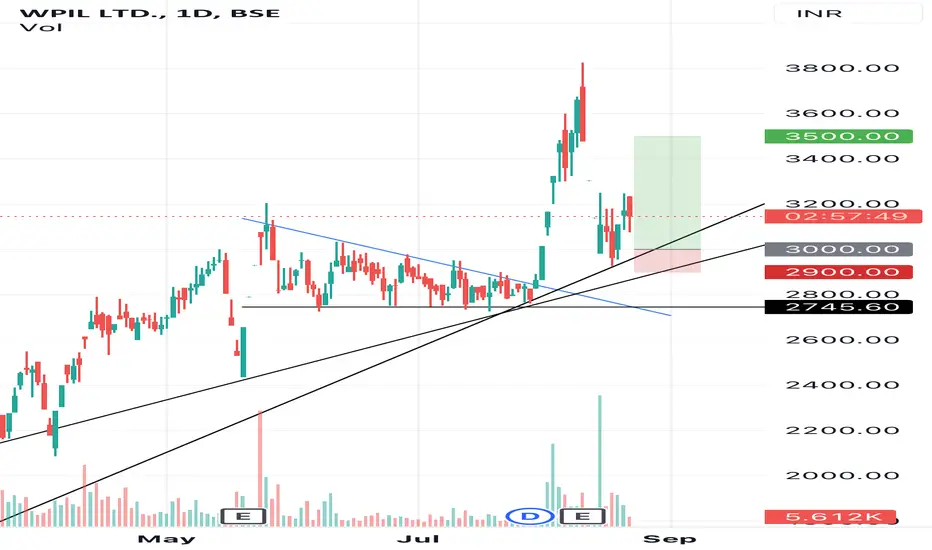
The stock is underpriced and is not in the overbought zone
Entry - 3000
Sl- 2900
Target- 3500-3700