Layered oscillation range, ,longLayered oscillation range, with the top layer rising and breaking through
Breaking through the upper boundary and rising
ZYDUSLIFE trade ideas

ZYDUSLIFE - Bullish Setup oNStock name - Zudus Lifesciences Limited.
✅#Zuduslife trading above Resistance of 1145.
✅Next Resistance is at 1490.
✅Moved 68% in 28 weeks.
Weekly chart setup
Chart is self explanatory. Levels of breakout, possible up-moves (where stock may find resistances) and support (close below which, setup will be invalidated) are clearly defined.
Master Score - B
Disclaimer: This is for demonstration and educational purpose only. this is not buying and selling recommendations. I am not SEBI registered. please consult your financial advisor before taking any trade.

Zydus Lifesciences Ltd - Breakout Setup, Move is ON...#ZYDUSLIFE trading above Resistance of 1128
Next Resistance is at 1297
Support is at 919
Here are previous charts:
Chart is self explanatory. Levels of breakout, possible up-moves (where stock may find resistances) and support (close below which, setup will be invalidated) are clearly defined.
Disclaimer: This is for demonstration and educational purpose only. This is not buying or selling recommendations. I am not SEBI registered. Please consult your financial advisor before taking any trade.

Zydus Lifesciences Intraday level for 5th July #ZYDUSLIFE Zydus Lifesciences Intraday level for 5th July #ZYDUSLIFE
Buying opportunity above 1145
Stop Loss area 1133
Charts for Educational purposes only.
Please follow strict stop loss and risk reward if you follow the level.
Thanks,
V Trade Point

ZYDUS LIFE Weekly Chart2 year high break
Cup & Handle Formation
Support 670
RSI above 60 Daily / Weekly / Monthly

#ZydusLife making Head&shoulder pattern,12% upmove dega kya? Zyduslife on daily time frame has made pattern based on popular shampoo brand "Head & shoulders". Or it can be called as cup n handle also. If we calculate depth of the pattern then upmove of 12%, above 670 looks achievable. I have gone long at the retest of breakout level at 675. Once 730 is achieved I will book 2/3rd qty and for the remaining qty will pust cost SL so there is no risk in the trade. Let's see if this stock gives me my targets or not

Navigate the markets strategically with Zydus LifeInvesting in Zydus Life, a prominent pharmaceutical entity, comes with strategic planning. With a stop-loss set at 995 and a target at 1050, investors can tactfully navigate the market's fluctuations.

ZYDUSLIFENSE:ZYDUSLIFE
One Can Enter Now !
Or Wait for Retest of the Trendline (BO) !
Or wait For better R:R ratio !
Note :
1.One Can Go long with a Strict SL below the Trendline or Swing Low.
2. R:R ratio should be 1 :2 minimum
3. Plan as per your RISK appetite and Money Management.
Disclaimer : You are responsible for your Profits and loss, Shared for Educational purpose

Zydus - Bullish Setup, Breakout RUN....Stock name - Zydus Lifesciences Limited.
✅#ZYDUS trading above Resistance of 919.
✅Next Resistance is at 1145.
✅Moved 35% in 9 weeks.
Weekly chart setup
Chart is self explanatory. Levels of breakout, possible up-moves (where stock may find resistances) and support (close below which, setup will be invalidated) are clearly defined.
Master Score - C
Disclaimer: This is for demonstration and educational purpose only. this is not buying and selling recommendations. I am not SEBI registered. please consult your financial advisor before taking any trade.

ZYDUSLIFE LONG ON DAILY CANDLE ANALYSISZYDUSLIFE LONG above 480 assuming ABC target 509, 529 and 549 stop loss of 450

ZUDUSLIFE - Long Setup, Move is ON....Stock name = Zudus LifesciencesLimited.
✅#ZYDUSLIFE trading above Resistance of 786
✅Next Resistance is at 919
✅Moved 17% in 7 Weeks
Weekly chart setup
Chart is self explanatory. Levels of breakout, possible up-moves (where stock may find resistances) and support (close below which, setup will be invalidated) are clearly defined.
Disclaimer: This is for demonstration and educational purpose only. this is not buying and selling recommendations. I am not SEBI registered. please consult your financial advisor before taking any trade.

zydusreceived six observations from the US Food and Drug Administration following the regulator's inspection of the company’s active pharmaceutical ingredients facility in Changodar, India, from Dec. 14 to Dec. 22.
The company plans to address the observations within the stipulated tim

Best cup and handle setup Best cup and handle setup in 15 mins at support. It's already broken a weekly trendline and going up. Now if that 15 mins trendline breaks, we can see some potential up move. It's only my view not a recommendation.

ZyduslifeStock name = Zydus Lifesciences Limited.
Weekly chart setup
Chart is self explanatory. Levels of breakout, possible up-moves (where stock may find resistances) and support (close below which, setup will be invalidated) are clearly defined.
Disclaimer: This is for demonstration and educational purpose only. this is not buying and selling recommendations. I am not SEBI registered. please consult your financial advisor before taking any trade.

ZYDUS LIFESCIENCES SWING TRADE IDEAZYDUS LIFESCIENCES gave weekly resistance zone breakout with gud volume and a strong bullish candle closed abv 52 weeks high today can play this stock for swing trade with your best RR.

Zyduslifesciences weekly cup and handle pattern breakoutZyduslifesciences weekly cup and handle pattern breakout buy above 668 for upside swing target of 732 and 831

Keep your trades simple_ZYDUS_TRADE_SETUPWhen a stock gives you a clean breakout, you take it!!
INR 650 level had been providing a strong resistance to this particular stock for more than 4 months now. The stock, in an attempt to go past this resistance made few dips and rallies which led to formation of an inverted head &shoulders pattern on the chart.
INR 650 was the neckline of the pattern and the stock broke the neckline and closed above it with vol expansion on Thursday's trading session.
The target pattern projection suggests an upward target of around INR720-730 for the stock.
INR 650 should be a major support now.
CMP - INR 657
SUPPORT - INR 650
TARGET - INR 720
SL - INR 635
Note*- The views expressed are based on personal observations/opinions. Please do you own research before making any trading decisions.

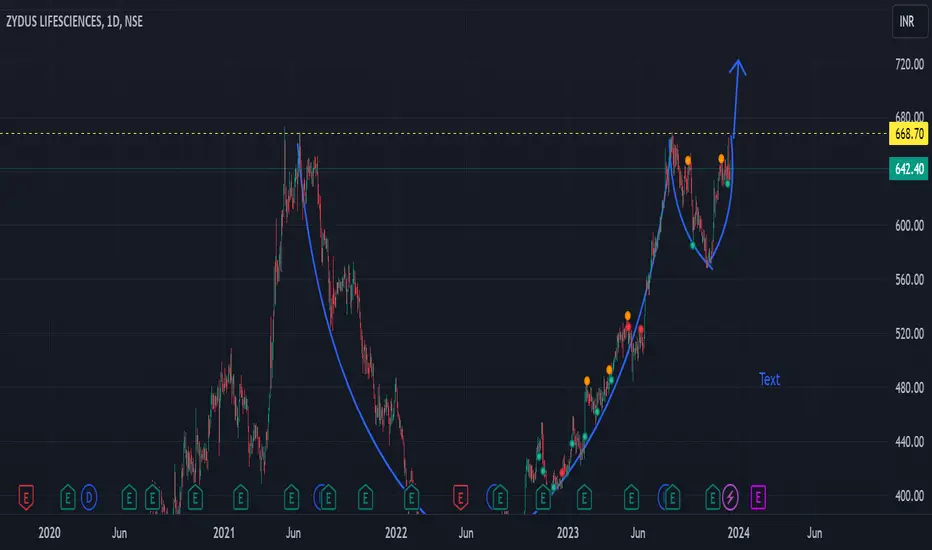
Zydus Life Cup and Handle Pattern on Weekly and Monthly ChartZydus Life Cup and Handle Pattern on Weekly and Monthly Chart, with rising EMA and positive RSI and MACD, expect good returns from it long investments.

CUP & HANDLE BREAKEOUT PATTERNAfter conducting an analysis of Zyduslife Stock, I've observed a promising cup and handle formation, indicating a potential breakout. Considering the current situation, a purchase at 633 seems opportune with a recommendation to hold.

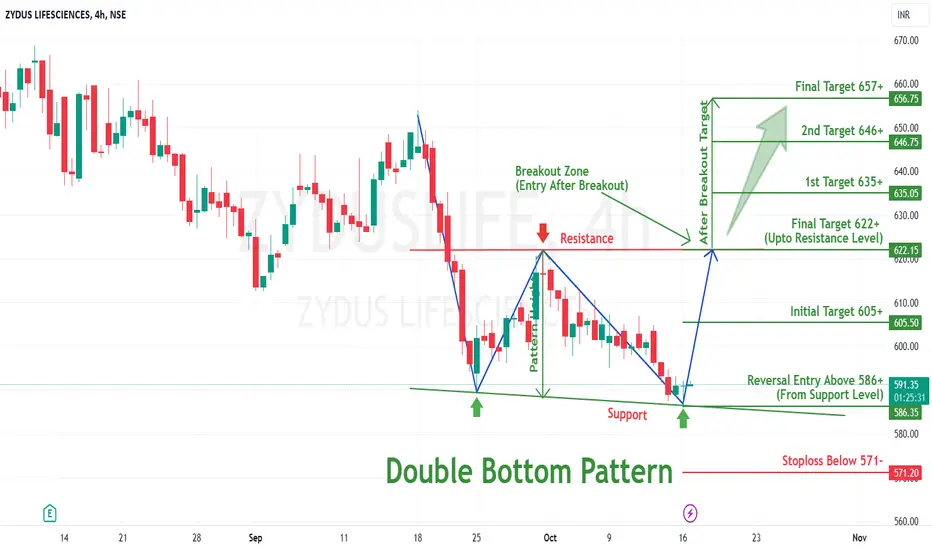
Double Bottom Pattern Reversal in ZYDUSLIFEZYDUS LIFESCIENCES LTD
Key highlights: 💡⚡
📊On 4 hour Time Frame Stock Showing Reversal of Double Bottom Pattern.
📊 It can give movement upto the Reversal target of Above 622+.
📊There have chances of Breakout of Resistance level too.
📊 After Breakout of Resistance level this stock can gives strong upside rally upto above 657+.
📊 Can Go long in this stock by placing stop loss below 571- or last swing Low.
ZYDUSLIFE go longgo long if it crosses : 603.35
entry price: 603.40
stop loss: 589.15
target: 639.40
This idea is for Educational purposes , i am not SEBI registered.

ZYDUSLIFE at an important levelZYDUSLIFE seems to be hitting 644.00 level multiple times but unable to break it out.
Hence that acts as an important resistance level.
Go long once the resistance level is broken and price breaks 645 level
First target could be 655.00 and second target could be 52-week high level (668.00)
Happy Trading :)
