BSWUSDT trade ideas

Wait the confirmationBuy bsw after breakout of 0.336 to confirm the breakout of the trendline if will done
Targets c wave of flat correction
Take profits at 0.379
Second target 0.5

Biswap (BSW) formed bullish Gartley for upto 45.50% pumpHi dear friends, hope you are well and welcome to the new trade setup of Biswap (BSW) with US Dollar pair.
On a daily time frame, BSW has formed a bullish Gartley pattern.
Note: Above idea is for educational purpose only. It is advised to diversify and strictly follow the stop loss, and don't get stuck with trade

BSWUSDT: Elliott Waves Intraday TradingTrade plan for BSWUSDT from my basket of investment decisions.
On BSWUSDT, a correction has been formed in the assumed wave 4 and momentum has already started to form in wave 1 of wave 5 (in wave C of wave 4).
I have already opened a long position and plan to increase volume in case of further growth.
All in all, the current situation allows me to plan an excellent trade with a risk to profit ratio of 1:5.
In case of successful development of the situation and completion of wave 5 above $0.42 level I plan to look for the point to open a short position with the purpose to gain profit in case of price decrease to $0.22 level.
Best Regards,
CEO Tornado Capital

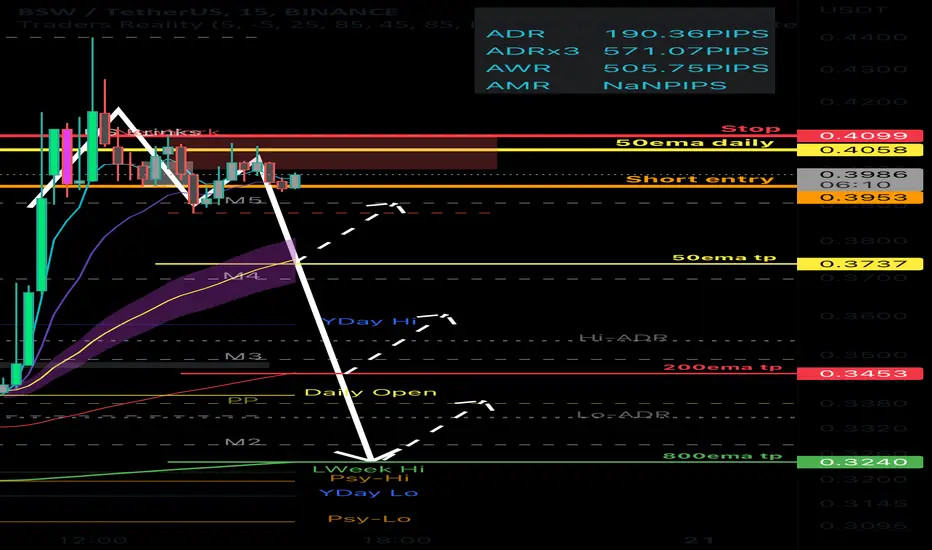
BSW - Potential Short - 1hr - Binance for BINANCE:BSWUSDTPERPTrade Status: ACTIVE
Trader: Drizzzled (AUS)
Trade Type: SHORT
Entry: 0.3953 (DCA trade)
Stop Loss: 0.4099
Take Profit Targets: 0.3737,0.3453,0.3240
Comments: move stop loss to break even once target 1 is hit. DCA entries above if stop loss is hit.
BSW current scenarioBSW broke the resistance just wait for retest and enter with a risk reward of 6. Never put all your funds in one coin always use sl and trade with a huge risk reward or atleast 2/3

Is BSW continues to fall? Here is the AnalysisHello my Fellow Traders :) The BSW price is now reached and mitigated my 61% POI/Demand zone. Now waiting for the confirmation in lower TF if the price will switch its direction towards my last POI/Supply Zone. Once confirm I will enter for LONG position and Target the last Point of Interest POI/Supply Zone.
Note: The price might continue to fall to reach 78-100% mitigation of Demand Or it will manipulated by institution and it will push the price at its origin of the Demand Injection during token lauch/listing on exchanges.
If this idea's is something good for you please consider to like and follow. Happy Trading Everyone

Bsw coin bullish run coming fastBsw bullish strength is strong and can go up to 80% today if Bitcoin stabilizes or moves up a little bit.
Remember, it's just my own idea. This is not a financial advice.

BSW/USDTBSW price chart slowly going up after it crashed down to $0.42. However this is still far from its price level before the crash. If BSW price will be able to rise beyond the 21 MA at the $0.72 area which is also the top of previous resistance area and where it currently retesting, then it will have a chance to retest the 0.618 Fib at $0.95. In case of rejection, it might revisit the former all time low last Oct of 2021 at $0.28.
1. My analysis is only based on my opinion and not a financial advise.
2. I am holding BSW as part of my portfolio.

BSW to 0.72$BSW broke the simetrical triagle !
1 target - 0.61$
2 target - 0.72$
stop lost - 0.55$
Good Luck !
TEAM TEKTRADING!


Best time to start DCA buyBSW is down 80% from ATH, it's a good time to start DCA buy. With a small market cap like this, can't ignore it as long term investment. BINANCE:BSWUSDT

Biswap Analysisthis crypto has a high potential to touch high targets . for the first step in 1 hour time frame put its analysis.
All entry points, stoploss and targets for this step is determineded on chart

🆓Biswap (BSW) May-05 #BSW $BSW
BSW could still have bull runs this May. However, it needs to hold onto the $1 zone because if it loses this zone, it will plummet to the $0.7 or even $0.6 zone by mid-May.
📈RED PLAN
♻️Condition : If 1-Day closes ABOVE 1$ zone
🔴Buy : 1.1 - 1
🔴Sell : 1.3 - 1.5 - 1.8
📉BLUE PLAN
♻️Condition : If 1-Day closes BELOW 1$ zone
🔵Sell : 1
🔵Buy : 0.7 - 0.6
❓Details
📈Red Arrow : Main Direction as RED PLAN
📉Blue Arrow : Back-Up Direction as BLUE PLAN
🟩Green zone : Support zone as BUY section
🟥Red zone : Resistance zone as SELL section


BSWUSDTMake a Swap at No Cost
Fee reimbursement of up to 70% in BSW tokens, 10% is credited to your Robi Boost & Squid Energy. You can change the percentage.
Max supply:
700 000 000
Total supply:
288 881 760
Circulating supply:
244 452 857
Total Burned:
30 369 628
Market Cap:
$277 376 012

Bullish on $BSWThis trade has hit a nice daily OB.
If it trade reverses and BTC does a flash crash. I am taking buys at 0.80 area

BSWUSDTAre we going to see this happens?!
I think its possible…
Interested to know your opinions and learn together.

BSWUSDT trade analysisBSWUSDT according to technical analysis, trade is in the accumulation range. As it is crossing the yellow area then we will see strong bullish position. We publish precise and compact information after careful consideration which give you quick glimpse for comparative analysis. Our aim is to deliver simple and compact information which can be used by beginner to give them brief understanding of trades without any complexity. if you have any question or want to ask about analysis of other pairs or you have any confusion about analysis then feel free to ask us. Don't forget to support by share your ideas and hit like and subscribe button. You can support us through coins donation for more frequent signals.

Long BSW BSW has been in a very great correction for a very long time after a very big pump in 24 hrs I think BSW is about to pump and it’s finding support at 0.9 and I think 0.9 is a very strong support with my following confluence
1 is already oversold at 4hr time Frame
2 trend line will be acting as support
3 formation of bullish descending triangle
4 divergence at the RSI indicated with the red line
The white lines are resistant level and should be considered as a partial Tp till the new ATH
Entry 1-0.9
SL 08-0.7
Tp 1.9-2.5
NAFA
DYOR

Bsw fresh Ideas... Dnt miss this! Currently trading below the resistance... @1.2
A break and close at @1.30 might see price moving up on a short term to 1.50...
On a long run, if price can break above 1.60...
Then we might see price testing the highs Again and possibly ATH.
Generally, I feel price will blast off the resistances
Eyes on price actions....
Arrows on chart 📉📈 shows some possibilities.....
Note: NFA
Pls, DYoR
Kindly like comment and follow me to encourage more content
Thank you!
Ge

BSW end of correction, beginning of a trendThe coin has good liquidity and excellent work of Elliot waves, completed the abc correction with a run-out and according to the first wave 12345, we buy more at fibonacci retracement levels
Thanks to our investors for their trust <3

BSW 1.45 Soon, retesting 1.3 resistance!Its hard to understand my chart but nothing to understand. just look at the red channel and indego trend resistance line.
It just broke the line so we can expect bullish movement from here.
