BTC Dominance – History Repeating? Altseason 2025 Loading? Hey Traders!
If you’re finding value in this analysis, smash that 👍 and hit Follow for high-accuracy trade setups that actually deliver!
This chart is SCREAMING for attention 👀
We’re at a critical inflection point on the weekly BTC Dominance chart — and if history has taught us anything, it’s that altseasons are born when dominance collapses from resistance.
🧠 Key Observations:
🔺 Macro Resistance Trendline:
Rejected in 2017 → Altseason 🔥
Rejected in 2021 → Altseason 🔥
Now (2025?) — BTC.D is again touching this same red trendline...
🟢 Support Trendline:
BTC.D formed a clean long-term support from which previous dominance drops have bounced — currently lining up around 42–45%.
📉 Previous drops after rejection:
2017: –50.79%
2021: –45.10%
2025 projection? –36.91% (which would bring us to the same support zone again)
🟡 What It Means:
If BTC.D gets rejected from this resistance again, it could mark the start of the long-awaited Altseason 2025. A breakdown from this wedge would likely result in capital rotation from BTC into altcoins — just like in previous cycles.
🔍 What to Watch:
A confirmed rejection from this red resistance line
Drop below the yellow wedge support
BTC sideways / ETHBTC strength = green light for ALTS
💥 This could be the altcoin opportunity of the next couple of years.
Conclusion:
All eyes on BTC Dominance — because when it falls, altcoins usually FLY.
📊 Stay updated, stay ready.
BTC.D trade ideas

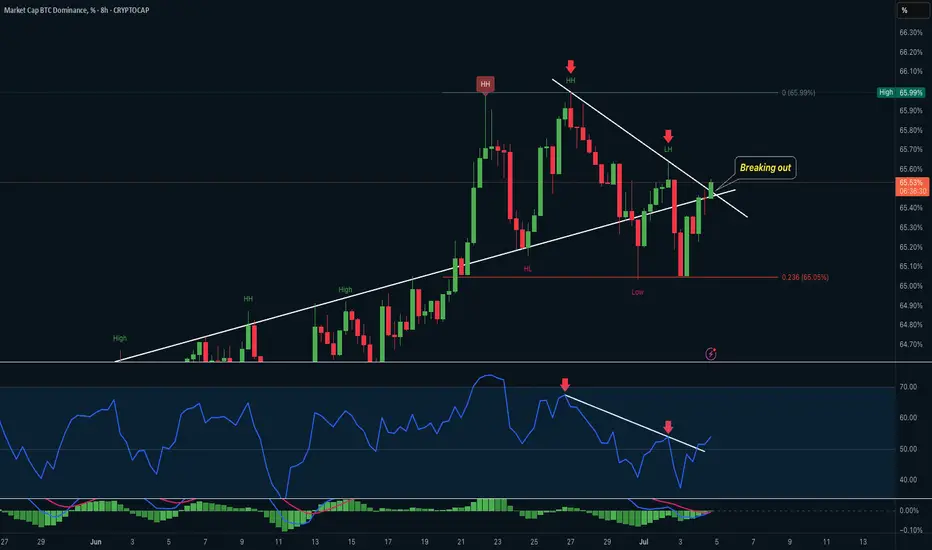
BTC Dominance & RSI – Bullish Breakout with Momentum Divergence RSI Breakout from Downtrend Line (8H)
• RSI broke out from a descending trendline after bouncing from a long-term rising support.
• This indicates a possible momentum reversal, confirming bullish divergence strength.
• The breakout is accompanied by a sharp recovery in RSI value from the 37–40 range.
BTC Dominance Price Action (8H)
• BTC.D has broken out from a descending structure after a double-bottom and trendline retest.
• Price has reclaimed the 65.5% zone, confirming the breakout with strength.
• Structure: HH → HL → Breakout = bullish continuation likely.
• Key support remains at 65.05% (0.236 Fib), while a move above 65.66%–65.79% (Fib confluence zone) will confirm further upside.
Bitcoin Dominance, RSI Bearish Divergence & Decreasing VolumeThis is a classic signal and we are going to be looking at it on two different timeframes, daily and weekly.
Bitcoin Dominance (BTC.D) is producing a strong bearish divergence with the RSI. The weekly timeframe is very pronounced and I will show you the details below. This type of signal tends to support a change of trend. It appears before the reversal happens but sometimes it can take years before it goes into effect.
» BTC.D Weekly RSI
Here you can see the RSI peaked October 2023. Then a lower high October 2024, then again in April 2025 and finally last month.
As the RSI produces lower highs BTC.D is producing higher highs.
This signal is supported by decreasing volume. Bitcoin Dominance continues to climb higher while trading volume continues to drop. Both signal support a change of trend soon and together they become stronger.
» BTC.D Daily RSI
The daily RSI peaked June 2023 but we will focus on the short-term as we already have a strong signal coming from the weekly.
Here we have a peak in May 2025 and a strong lower high in June. Needless to say, BTC.D peaked 27-June thus the divergence but the action is clearly weak.
» Bitcoin daily
There is a long-term rising wedge on the weekly timeframe and this pattern can also support a reversal.
All these signals are bearish but not very strong, still, there is some weakness on the bearish side for this index. This means that the action can turn bearish tomorrow or it can continue rising for weeks or months before turning red.
These signals are pointing to a reversal but they do not give us a specific date. Can happen next week, next month or in seven months. If we focus on the altcoins, the way they are looking and how long will it take for them to grow, then this index can turn bearish within 2-4 weeks. Bitcoin will also grow as the altcoins market grow. Everything Crypto will grow in late 2025.
Thanks a lot for your continued support.
Namaste.

BTCDIs this chart not crazy to look at.
You didn’t even have to front run alts this cycle just still in BTC until it’s time.
This next candle you would think we will see red.
#BTC.D (BTC-DOMINANCE) - Cheat sheet#BTC-DOMINANCE
The asset has many strong features to achieve its goal.
This text does not contain recommendations on financial transactions or investments.

Will altcoins start to recover from here?BTC dominance is currently testing a key trendline resistance—mirrored by weakness in the Chaikin Money Flow (CMF) index as well.
Could this signal the start of an altcoin recovery?
If Bitcoin breaks above the weekly resistance zone at $114,000–$115,000, it would likely pave the way for a full-fledged altcoin season in the months ahead
Disclaimer:
This analysis is based on my personnal views and is not a financial advice. Risk is under your control.

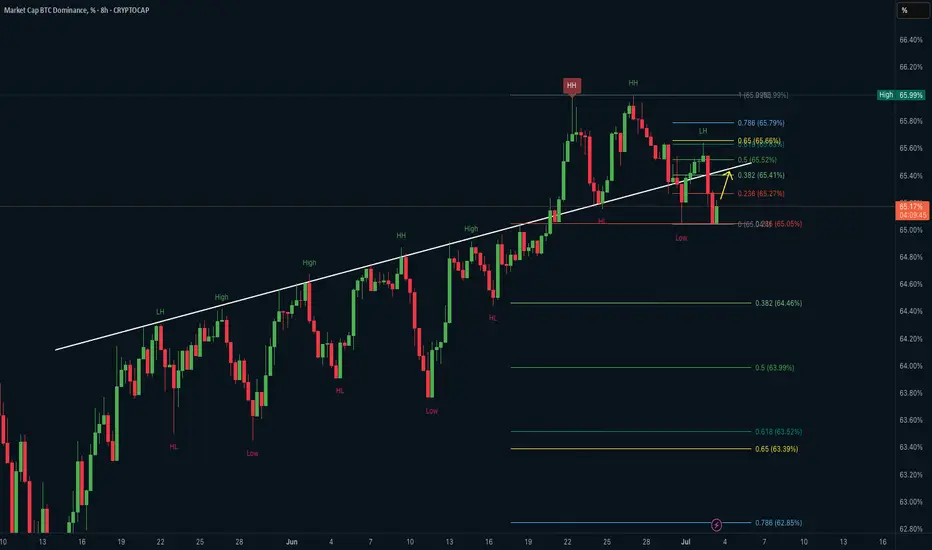
BTC Dominance – Trendline Break & Retest Zone Reaction in PlayThis analysis focuses on the 8 hour chart of Bitcoin Dominance (BTC.D), showing a possible retracement bounce after a recent market structure shift.
Key observations:
• BTC.D formed a higher high (HH) before pulling back sharply to a key demand zone.
• A long term ascending trendline has been broken and is currently being retested from below.
• Price tapped the 0.236 Fib retracement zone and is now bounce hard from that level.
• The yellow arrow suggests a possible short term move back toward the 0.382 or 0.5 Fib levels (~65.4%–65.5%).
Key levels to watch:
• Resistance: 65.52%, 65.66%, 65.79% (Fib cluster + previous LH)
• Support: 65.05% (local low), below which further downside may unfold
• A strong rejection at the 0.65 level could confirm lower high structure continuation
BTC Dominance is important for altcoin traders:
A rise in BTC dominance usually indicates capital rotating into BTC and away from alts, while a drop opens opportunities for altcoin strength.
renderwithme | BTC - Dominance about to hit resistanceBitcoin dominance (BTC.D), which measures Bitcoin’s market capitalization as a percentage of the total cryptocurrency market cap, is a key indicator of market sentiment and capital flow between Bitcoin and alt coins . As of July 5, 2025, recent data and technical analysis suggest Bitcoin dominance is at a critical juncture, with potential shifts in market dynamics for the upcoming week. Below is an analysis based on current trends, historical patterns, and technical indicators.Current State of Bitcoin DominanceCurrent Level: Bitcoin dominance is approximately 64.36% to 65.68%, based on recent data .
Recent Trends: Dominance has been testing a multi-year resistance zone between 66.5% and 69.5%
Historical highs in this range (e.g., 64.34% in early 2025) have often preceded pullbacks or altcoin rallies.
Chart indicate bearish signals, such as weekly bearish divergences and potential reversal candles, suggesting a possible decline.
Technical Analysis for Next WeekResistance and Support Levels:Resistance: The 66.8%–67.2% zone is a critical resistance level, aligning with Fibonacci extensions and a long-term descending trend line. A failure to break above this could signal a reversal.
Support: Key support levels are at 61.90%–62.20%, with a potential drop to 58% if bearish momentum accelerates.
Chart for your reference
Disclaimer --
This analysis is based on recent technical data and market sentiment from web sources. It is for informational purposes only and not financial advice. Trading involves high risks, and past performance does not guarantee future results. Always conduct your own research or consult a SEBI-registered advisor before trading.
#Boost and comment will be highly appreciated
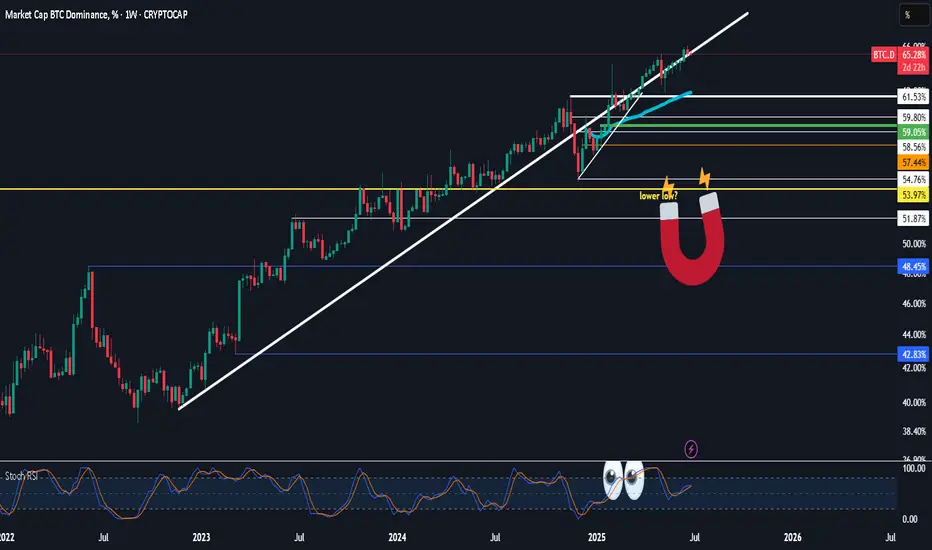
$Btc.dnever thought we would get so high ... heheh no pun intended
so following up on my wif trade thoughts this is where the fun begins for alts with volatility along the way and time to swap to bitty at the magnet .. hwoever long it takes
rsi just needs to roll over and we wait and see the weekly close for confirmation really doubt we push higher but if bitty decides to leg up then we just wait some more
Bitcoin Dominance Daily Bullish Altcoins ConfirmedThere is an interesting signal here on the daily Bitcoin Dominance index chart. Four days red. This signal has not happen since February and it is most certainly bearish.
After 26-June the index went red four days after hitting the highest reading since January 2021. This highest reading ended up producing a rounded top and the action moved back below the 7-May top which was the previous highest reading since 2021.
Now notice the purple line on the chart. This is the 7-May peak price. Yesterday, BTC.D was trading above this level but moved below today. The candle ended as a Doji, lower high and today turning bearish signals growing bearish momentum.
You can check the weekly timeframe for additional signals including the MACD and RSI. You can find it by visiting my profile @MasterAnanda (Make sure to follow.)
In November 2024 BTC.D went extremely bearish and the entire altcoins market produced a major advance; Bitcoin also moved forward, the same can happen today. It is not certain the specific date, can be tomorrow, in a weeks time or within months... What is certain is that the bullish wave won't last as little as in April-May 2025 nor November-December 2024, both instances lasted only one month, this time around the bullish wave can last between 3-6 months.
Some pairs will grow straight up for months. Others will experience strong volatility but with a bullish bias. Marketwide bullish action. Bitcoin and the altcoins.
Thank you for reading.
Namaste.

BTC Dominance about to reject, good news for alts 👉 Bitcoin dominance has reached a highly critical trendline, which also coincides with a strong PRZ. Personally, I expect a rejection and a correction from this area, which could potentially lead to a positive trend in the altcoin market.
⏳ My trigger for entering altcoins is a bearish signal on the lower time frame of the Bitcoin dominance chart. So until that happens, I prefer to stay patient and remain out of the market
BTC.DBitcoin’s dominance is sitting at a crucial 65% level, and the market is at a crossroads. This zone has been a major battleground before—will history repeat itself?
If BTC.D holds and breaks higher, we could see a return to Bitcoin’s dominance, pushing toward 70% or more. That would mean alts bleeding against BTC, and traders might want to focus on BTC pairs or even short weaker altcoins.
But if this level rejects and dominance drops back under 63%, it could be the signal for an altcoin rally. Money could quickly rotate into ETH, SOL, and high-beta plays, especially if BTC consolidates.
The key triggers? Watch ETF flows, macro sentiment, and volume. A clean breakout or breakdown will set the tone.

Bitcoin Dominance Nearing a Top — Altseason Incoming in JULYBitcoin Dominance (BTC.D) is approaching overbought levels on several key oscillators across multiple timeframes. While the 1-Week chart still shows momentum that could push BTC.D slightly higher over the next few weeks, the indicators are signaling an upcoming shift.
📅 Timing the Rotation:
We're eyeing mid to late July as the likely window for a rotation into altcoins. This would mark the beginning of a potential mini altseason, where top-performing altcoins could outpace Bitcoin for a limited but lucrative period.
💼 Strategy Insight:
This could present a strong opportunity to trim or exit older alt positions from earlier in 2024—especially if they rally hard during this period of temporary dominance weakness.
🔍 Watch the oscillators and volume trends closely. The BTC.D reversal could be subtle at first but may lead to outsized moves in select alts.

BTC.D Showing Cracks ?Hello Traders 🐺
In this idea, I want to talk about one of the key factors driving the crypto market — something we all know plays a major role: BTC Dominance (BTC.D). In my opinion, understanding BTC.D movements gives us a powerful edge if we interpret them correctly.
Let’s break it down:
📉 On the daily chart, we’re seeing clear signs of weakness.
First, there’s a bearish divergence on the RSI. For those unfamiliar, this occurs when price makes a higher high, but RSI makes a lower high. It’s a signal that buying pressure is fading — meaning fewer buyers are stepping in compared to the previous push. This is a classic early sign of a potential trend reversal.
Second, price is forming a rising wedge, which is typically a bearish pattern. If this plays out, we could see BTC.D drop toward the bottom of the wedge, aligning with the ascending channel’s support — where a potential bounce might occur.
📌 But here’s the big picture:
We are very close to what could be the start of Altcoin Season, and I’ve been emphasizing this almost every week. I encourage you to review my previous idea on BTC.D for a deeper perspective (linked below this post).
Stay sharp, stay disciplined — and be ready for the volatility ahead.
🐺 Discipline is rarely enjoyable, but almost always profitable. 🐺
🐺 KIU_COIN 🐺

Wait for all currencies to fall further and sell your tokens.There is currently no news of growth in Ethereum and altcoins, and every time it goes up, there is an opportunity to exit and it is a trap. Ethereum and altcoins are only for sale. Soon Cardano will be 0.08, Ethereum 600,
Dogecoin 0.003,
Shiba 0.0000001,
and the rest will fall, and they will only release tokens and swallow your dollars in the name of Alt Season.
BTC DOMINANCE at pivotal juncture.Which direction do you favour?
The chart is inverted, so the up move will result in #Alts outperforming #Bitcoin.
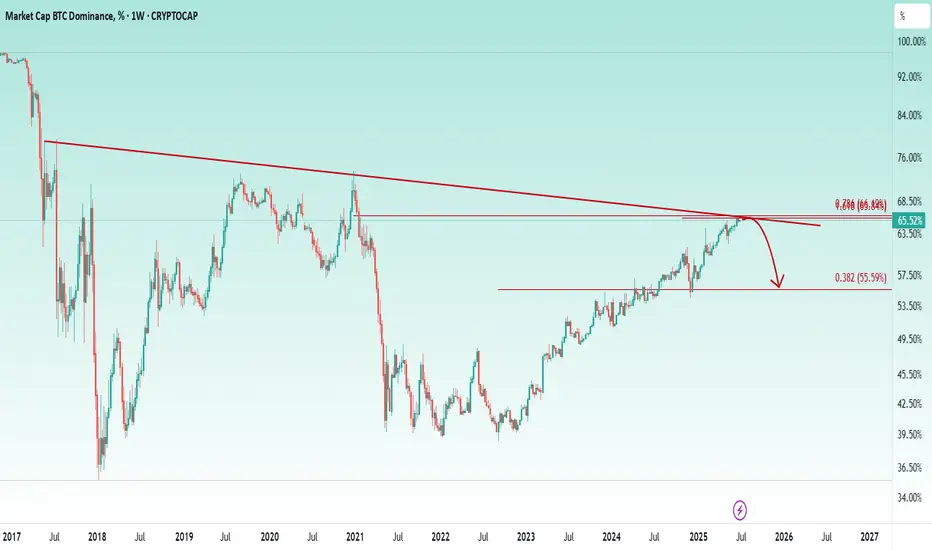
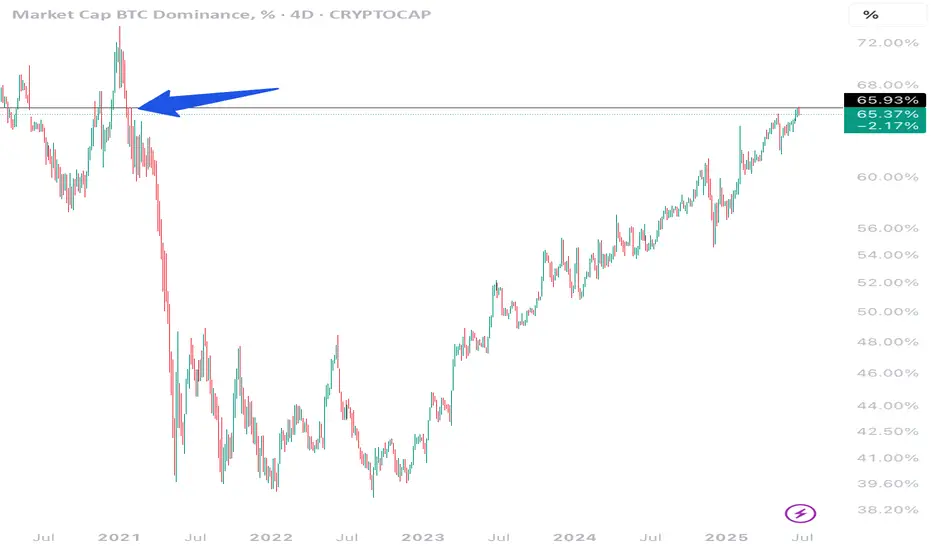
Bitcoin Dominance Is at the Edge and Fundamentals Are PushingCRYPTOCAP:BTC.D Bitcoin dominance (BTC.D) is pressing right into a massive multi-year trendline that has capped it since 2018. We have seen higher lows building since 2022, tightening this squeeze even more. Now it is decision time.
The fundamentals might just tip the scales.
David Sacks says July could be a huge month for crypto. Bakkt is lining up a 1 billion dollar shelf offering that could directly buy BTC. Meanwhile US regulators are pushing hard to finalize crypto market structure rules by September. On top of that, ETFs and big institutional players keep funneling money primarily into Bitcoin, not altcoins.
All this is fueling the case for a breakout in BTC dominance. If it happens, Bitcoin will likely outperform the rest of the market for a while, pulling more of the crypto share back into its hands.
If the chart rejects, we might see altcoins catch some wind and take the spotlight for a bit. But right now with this macro pressure building, the odds seem to favor Bitcoin leading the next leg.
Keep an eye on this chart. A clean breakout above the trendline could set the stage for a very Bitcoin-heavy next few months.

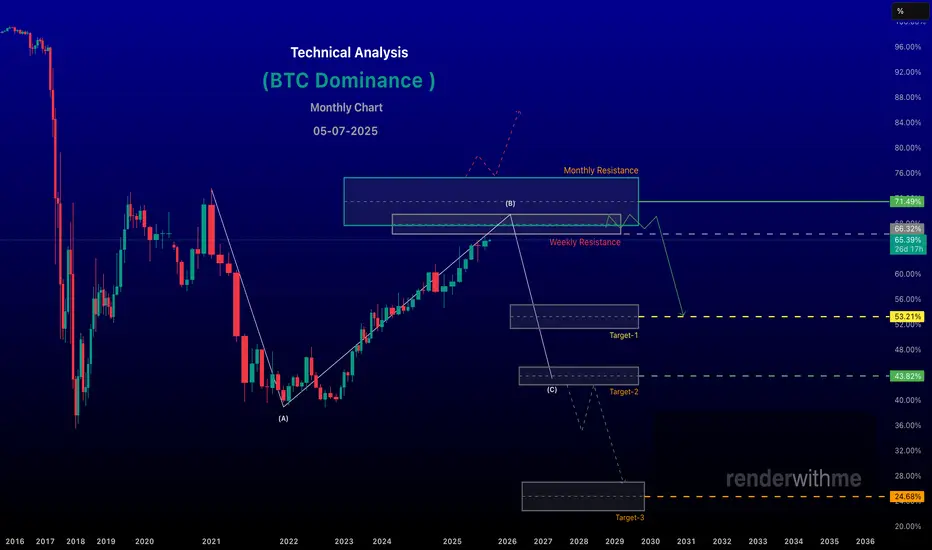
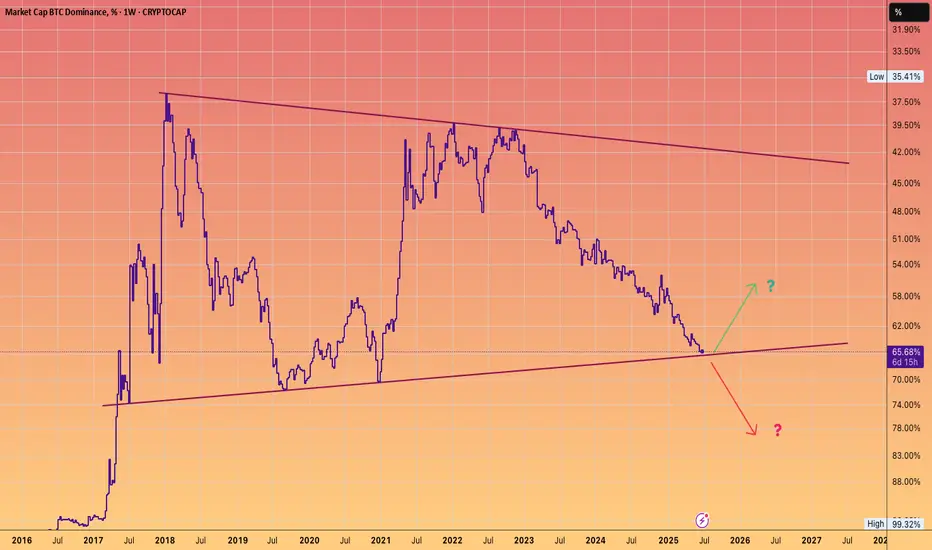
BTC.D Nearing a Historic Inflection PointBTC Dominance (BTC.D) is fast approaching the 67.64% resistance level, sitting firmly within a key supply zone marked at point D. This area represents a high confluence region, aligning with a long-term descending trendline and the upper boundary of a bearish wedge structure.
If validated, this would complete a potential ABCDE reversal formation suggesting a macro top in Bitcoin dominance may already be forming.
A rejection from this zone could trigger a pullback towards the immediate support at the 60% level. Should this level break, further downside may unfold toward 54.64%, with a deeper long-term target resting around the 45% zone.
This setup could mark a significant turning point if dominance begins to unwind, we may witness an aggressive rotation into altcoins. Keep a close eye on structural breaks and liquidity sweeps.
Alt season might just be closer than we think.
What’s your take on this potential shift? Let’s discuss in the comments.

Bitcoin Dominance :When altseasonOnly 63 days left until we will start witnessing another altseason.
2 more months and the path to a crazy alt run will begin.
Let us be patient.

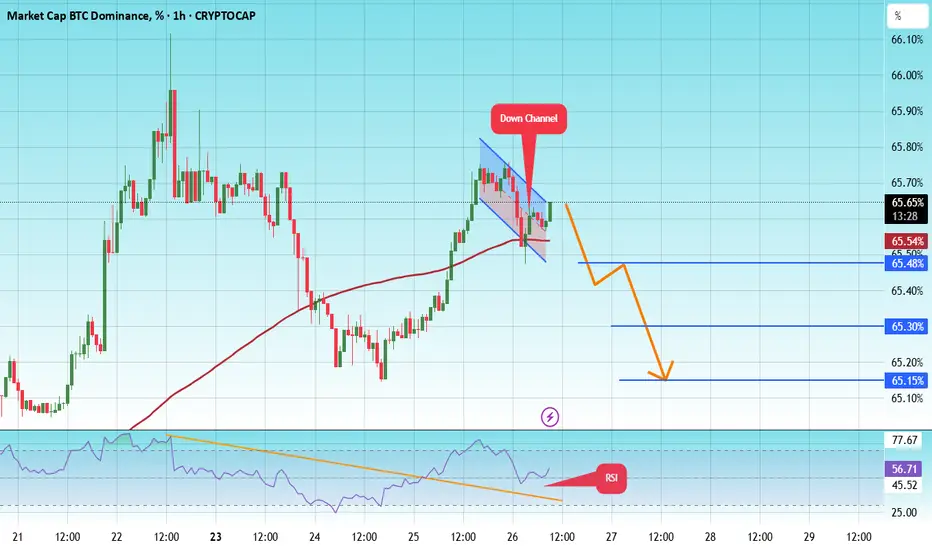
BTC Dominance New Update BTC.D
We are at a critical juncture in Bitcoin's dominance.
A major decline in Bitcoin's dominance has likely already begun. If the green zone is lost, dominance could see a sharp decline, especially since the last wave of this diagonal pattern, Wave G, touched the 0.618 Fibonacci level.
However, there is still a possibility that the green zone could push the price back close to the previous high before we see a decline in dominance. However, there are also indicators that the major decline may have already begun. Follow the chart closely and monitor it closely.
First Target: 65.50%
Second Target: 65.30%
Third Target: 65.15%
To manage risk, don't forget about stop loss and capital management.
It's over for BTC Dominance, benjamin cowen is wrong hereAlt rally time :) . it will be incredibly hard to overcome this resistance on the chart. Don't listen to benjamin cowen at this point, he is too bullish on btc still. Cya in a few weeks when he changes his mind.
BTC.D Daily – Bearish ShiftBTC.D on the daily is turning bearish.
PSAR has flipped bearish, and MLR < SMA < BB center — a clear sign we could see lower levels ahead.
The next possible support is the 50MA.
Always take profits and manage risk.
Interaction is welcome.

Altseason Loading? BTC Dominance Hits Key Resistance!The BTC Dominance chart is once again testing a key long-term weekly resistance.
Historically, this trendline has marked major turning points, and each rejection has given altcoins room to rally.
If we see another rejection here, it could mark the beginning of a strong altseason.
Like and retweet if you are with me! 🤝
#ALTSEASON INCOMING! 🔥
