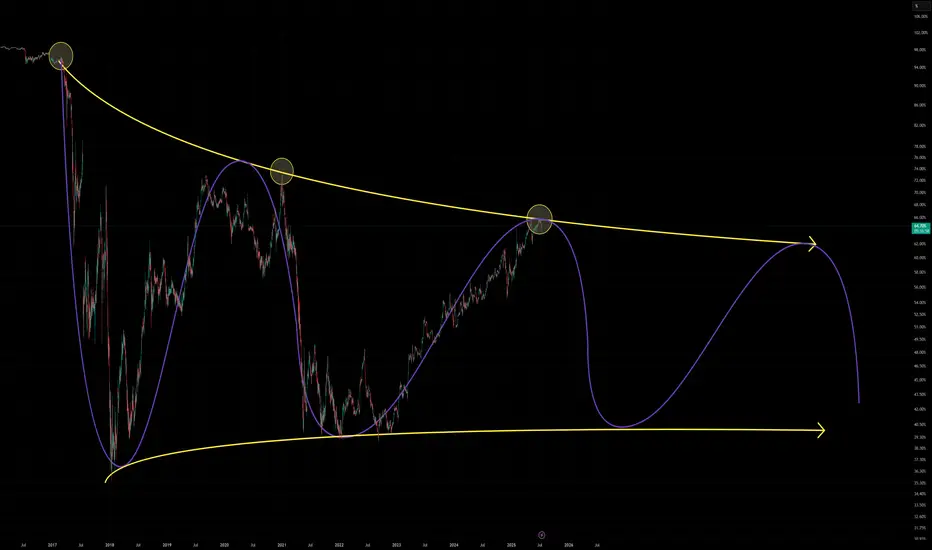
Bitcoin wave BTC.DBTC dominance appears to have hit a cycle peak at 66%!
We might be nearing a turning point, with the yellow circle highlighting the potential top.
BTC.D trade ideas
BTC Dominance Maintains UptrendBTC dominance continues its climb toward the 73% region, with no significant signs of altcoin capital rotation at this stage. Market structure remains intact in favor of Bitcoin leadership.
Bitcoin Dominance Rebounds – Bad News for Altcoins??📊⚠️ Bitcoin Dominance Rebounds – Bad News for Altcoins? 🧨💣
Today’s chart says it clearly: Bitcoin Dominance is bouncing off support at the edge of its ascending channel. This rebound zone around 64.58–64.64% has been critical — and the move up confirms it’s holding… for now.
❗ With Bitcoin itself facing heavy resistance, this dominance bounce is not good news for altcoins. In fact, it's a classic setup for capital rotating into BTC and out of alts — not the other way around.
📌 Chart Breakdown:
Biggest alt bull runs have started when BTC.D failed here — not when it rebounded
Breakout above 71.3% = serious risk of altcoin extinction
Breakdown below 62.3% = green light for altseason
🧠 As I’ve written on the chart: the END of alts comes not just from price — but from meme culture, utility decay, and market maker manipulation. That zone? 97% BTC.D. We’re not there, but we’re not heading toward freedom yet either.
🎥 Want to see how this fits into the full market picture? Watch the July 10th macro update:
👉 July 10th Market Outlook – Uncharted Waters, Uncertain Momentum
The market’s pressure is rising.
No good news from BTC.D today.
One Love,
The FXPROFESSOR 💙
Disclosure: I am happy to be part of the Trade Nation's Influencer program and receive a monthly fee for using their TradingView charts in my analysis. Awesome broker, where the trader really comes first! 🌟🤝📈

Bitcoin Dominance, RSI Bearish Divergence & Decreasing VolumeThis is a classic signal and we are going to be looking at it on two different timeframes, daily and weekly.
Bitcoin Dominance (BTC.D) is producing a strong bearish divergence with the RSI. The weekly timeframe is very pronounced and I will show you the details below. This type of signal tends to support a change of trend. It appears before the reversal happens but sometimes it can take years before it goes into effect.
» BTC.D Weekly RSI
Here you can see the RSI peaked October 2023. Then a lower high October 2024, then again in April 2025 and finally last month.
As the RSI produces lower highs BTC.D is producing higher highs.
This signal is supported by decreasing volume. Bitcoin Dominance continues to climb higher while trading volume continues to drop. Both signal support a change of trend soon and together they become stronger.
» BTC.D Daily RSI
The daily RSI peaked June 2023 but we will focus on the short-term as we already have a strong signal coming from the weekly.
Here we have a peak in May 2025 and a strong lower high in June. Needless to say, BTC.D peaked 27-June thus the divergence but the action is clearly weak.
» Bitcoin daily
There is a long-term rising wedge on the weekly timeframe and this pattern can also support a reversal.
All these signals are bearish but not very strong, still, there is some weakness on the bearish side for this index. This means that the action can turn bearish tomorrow or it can continue rising for weeks or months before turning red.
These signals are pointing to a reversal but they do not give us a specific date. Can happen next week, next month or in seven months. If we focus on the altcoins, the way they are looking and how long will it take for them to grow, then this index can turn bearish within 2-4 weeks. Bitcoin will also grow as the altcoins market grow. Everything Crypto will grow in late 2025.
Thanks a lot for your continued support.
Namaste.

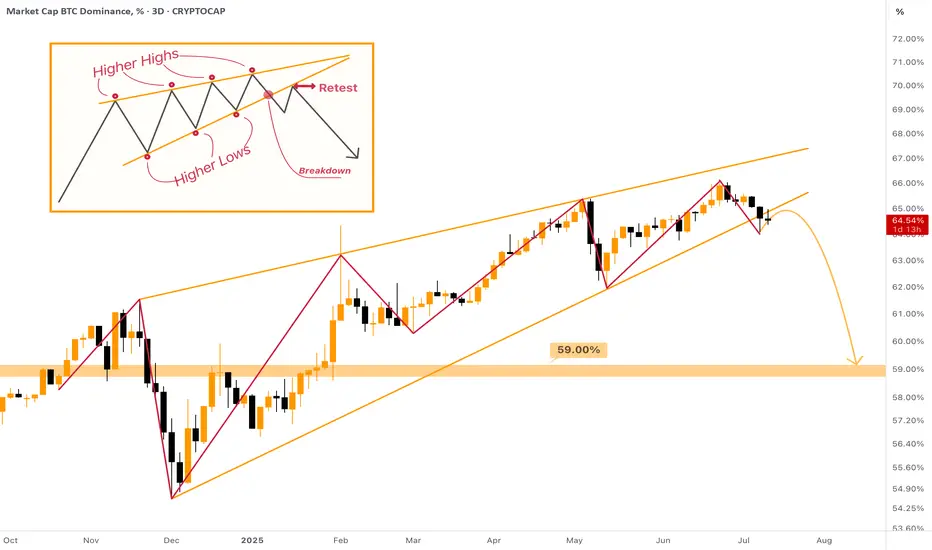
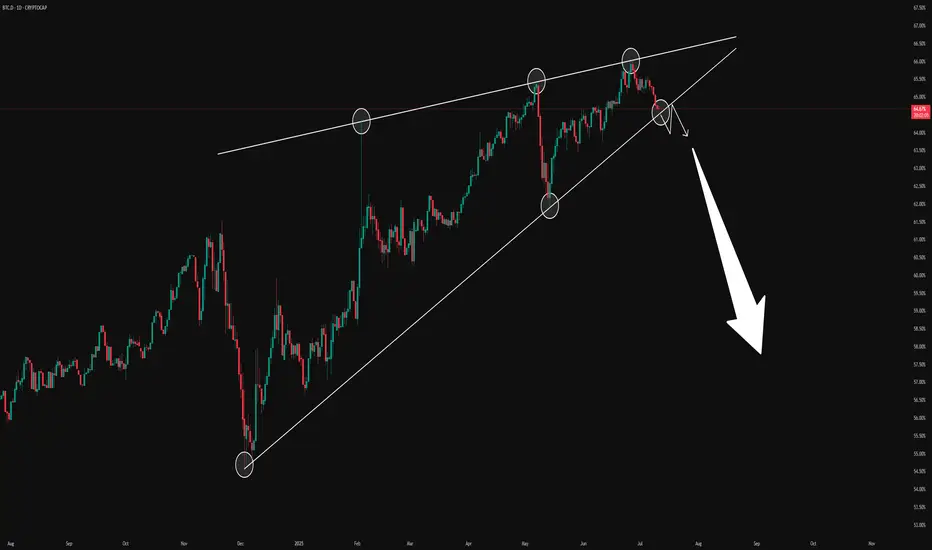
Rising Wedge on Bitcoin Dominance - [BROKEN DOWNWARDS] The MASSIVE Rising Wedge on Bitcoin Dominance was broken downwards during the past week, most likely the 1W candle will also close below the support of the wedge.
What does it mean? The dominance will dump from 64% to at least 59%. This move can already provide us with the huge Altcoin Season! After this there more likely be a small correction towards 60%, and then we can freely dump further towards 54% zone.
I expect not only small cap, but major altcoins to be sent to new highs as well. Mark my words & be prepared for the last opportunity of this bull cycle!
Bitcoin Dominance about to flip BIG TIMEWe are about to see a kind of altseason only investor from 2017 can remember !
here is a possible ranking for the bull run peak !
and Yes, I believe XRP will flip ETH and retrieve it's historical 2nd spot !
Altcoin market cap forecasts of $5T to $8T
Forecast Ranking
Rank Coin Target Price Estimated Market Cap
1 BTC $200,000 $3.96 Trillion
2 XRP $30 $1.71 Trillion
3 ETH $12,000 $1.45 Trillion
4 SOL $2,500 $1.18 Trillion
5 DOGE $5 $733 Billion
6 BNB $4,000 $584 Billion
7 ADA $7 $250 Billion
8 LTC $2,000 $150 Billion
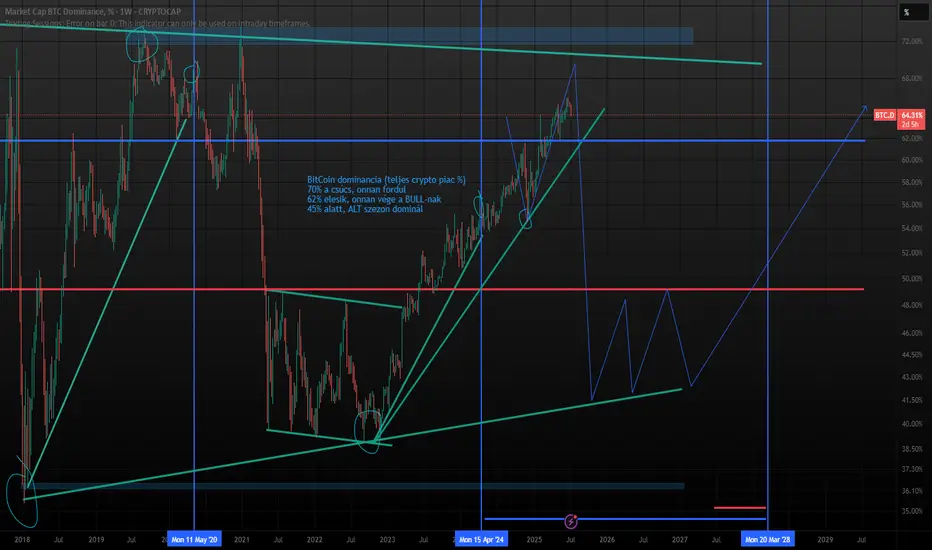
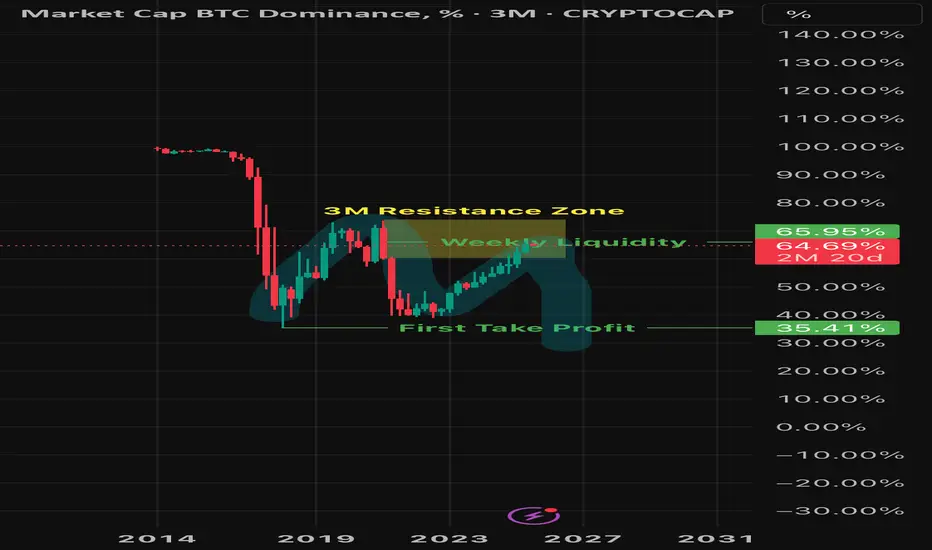
BTC.D dominance is close to its peakBTC.D dominance is close to its peak.
Around 70% is expected to peak
falls below 62%, end of Bitcoin BULL trend,
below 45% ALT season dominates.
Blue vertical line for 4-year cycles (halving)
Bitcoin Dominance Daily Bullish Altcoins ConfirmedThere is an interesting signal here on the daily Bitcoin Dominance index chart. Four days red. This signal has not happen since February and it is most certainly bearish.
After 26-June the index went red four days after hitting the highest reading since January 2021. This highest reading ended up producing a rounded top and the action moved back below the 7-May top which was the previous highest reading since 2021.
Now notice the purple line on the chart. This is the 7-May peak price. Yesterday, BTC.D was trading above this level but moved below today. The candle ended as a Doji, lower high and today turning bearish signals growing bearish momentum.
You can check the weekly timeframe for additional signals including the MACD and RSI. You can find it by visiting my profile @MasterAnanda (Make sure to follow.)
In November 2024 BTC.D went extremely bearish and the entire altcoins market produced a major advance; Bitcoin also moved forward, the same can happen today. It is not certain the specific date, can be tomorrow, in a weeks time or within months... What is certain is that the bullish wave won't last as little as in April-May 2025 nor November-December 2024, both instances lasted only one month, this time around the bullish wave can last between 3-6 months.
Some pairs will grow straight up for months. Others will experience strong volatility but with a bullish bias. Marketwide bullish action. Bitcoin and the altcoins.
Thank you for reading.
Namaste.

I drew out this BTC.d chart flow based on the daily I noticed the last support line on the daily so I drew a pattern I felt would follow if that support was broken. Coincidentally I nailed it.
Dominance & Altcoins- This graph is purely based on fibonacci law.
- 61.8% is the core of the system ( check rectangles in graph to get it )
- Most of long term traders not even look at the price.
- they just wait the good time to buy using Fibo.
- in 2016 BTC was almost 100%. Altcoins were inexistant. (less than 2% of the market with ETH)
- in 2021 BTC Dominance pushed to 75% (altseason followed the push)
- in 2024 we could see BTC dominance knocks 60% ish ( Altseason will follow )
- BTC is maturing.
- Cryptos are growing.
- Don't look too much at your altcoin wallets.
- Most of the time the story repeats itself.
- Respect the cycle, be patient and eat noodles!
Happy Tr4Ding !

BTC.D The END GAME ( like AVENGERS ! )Hello Traders 🐺
Before we begin, I’d like to name this idea "The End Game" — just like the Avengers movie! 😄
Because honestly… there’s almost no more room left for BTC Dominance (BTC.D) to go higher — and here’s why:
📉 Bearish Divergences Everywhere:
Whether you’re on the daily, weekly, or even monthly chart — bearish divergences are all over the place.
In fact, this setup reminds me of the opposite situation — when BTC.D was deeply oversold before launching into a massive rally.
But what does this mean?
🚨 Is the Bull Run Over? Or Just the Calm Before the Storm?
Let’s break it down:
As you probably know, BTC.D dropping = Altcoin Season — and in my opinion, this BTC cycle is a supercycle. That means it's extended, more powerful, and broader than usual.
So when dominance reverses, ETH and the top 100 altcoins could enter their own supercycle phase — leading to a much bigger altcoin season than the previous one.
🎯 Key Level to Watch:
BTC.D is now hovering near a critical support zone.
If this support fails, we may see a rapid drop toward the next support near the 60% level, which aligns with the lower boundary of the long-term channel.
🔥 Prepare yourselves. The end game for BTC.D could be the beginning of the real Altcoin Season.
💬 What’s your take? Are you positioning for the shift?
🐺 Discipline is rarely enjoyable, but almost always profitable. 🐺
🐺 KIU_COIN 🐺

Can an alt-season occur?Hello friends..
The area marked in Bitcoin dominance is an important area for market rotation, now what does market rotation mean?
That is, if Bitcoin dominance is corrected, we can see altcoins grow more than Bitcoin.
That is, in this period, the profit of altcoins will be greater than Bitcoin.
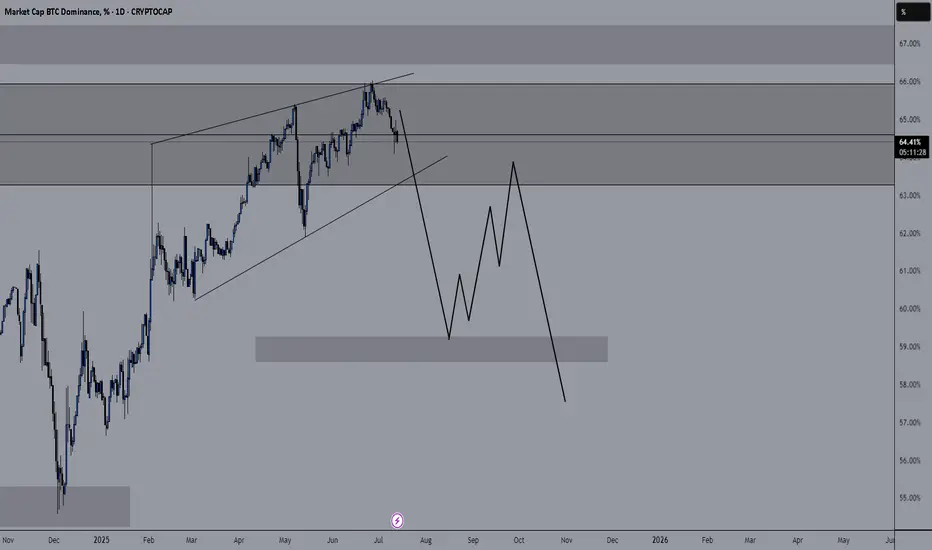
BTC.D: Almost Time...Large rising wedge on the daily chart since December 2024.
If we get this breakdown + retest, BTC dominance will tank.
BTC Dominance (BTC.D) — Weekly Failed AuctionChart Context
• Instrument: CRYPTOCAP:BTC.D
• Time-frame: 1-Week
• *Key vLevels (dashed):
• 68 % – 2021 supply pivot
• 66-68 % zone – recorded a Weekly Failed Auction (wick above, close back below)
• 62.50 % – mid-range support / prior breakout shelf
Failed Auction at the Top
Price wicked into the 66-68 % vLevel but closed lower.
On a weekly chart that pattern often marks exhaustion; bulls couldn’t maintain control.
First Support = 62.50 %
If BTC.D trades < 62.50 % and closes a weekly bar there, odds rise that capital rotates out of BTC and into alt-coins.
Historically this breakdown triggers the early stages of alt-season (see 2021 analogue).
Invalidation
Weekly close > 68 % negates the failed auction and points to renewed BTC strength (alts lag).
How I’ll trade / allocate
Spot BTC bias – overweight BTC while dominance holds > 62 %.
Alt-coin rotation – shift 20-35 % into high-conviction alts only after a confirmed weekly close < 62 % and follow-through below 60 %.
Risk checks – trim alt exposure back to cash/BTC if dominance reclaims 62 % after a breakdown (failed alt-season).

BTC DOMINANCE Looks Bearish (1D)Bitcoin Dominance seems to have completed its bullish structure.
An order block is forming and has been broken to the downside, a trigger line has been lost, and wave g has come to an end.
If Tether dominance also declines, altcoins may remain in the green.
The 62 level is the target drop zone for this index.
For risk management, please don't forget stop loss and capital management
Comment if you have any questions
Thank You

BTC Dominance is OverCome one, come all, Bitcoins Dominance begins to fall. Alt coins are at the threshold of the precipice but like machines made to climb, they will do so with grace, ruthlessness and unforgiving elegance. Bitcoin may be the first cryptocurrency but does it matter if it’s the best?
BTC.D UPDATEShould finally be about time. Wow. Cliff edge just waiting to happen.
Not financial advice

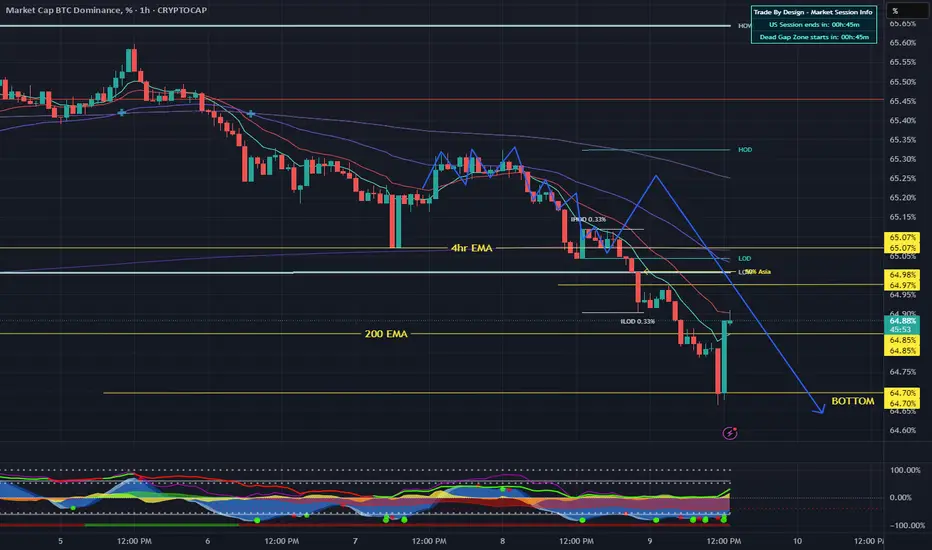
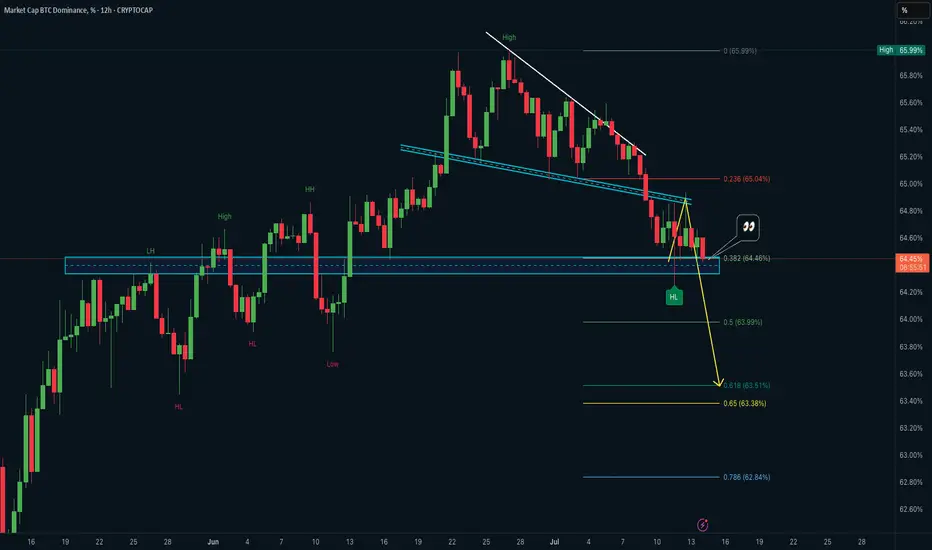
BTC Dominance at Critical Breakdown Point: Alts Could Shine NextBTC Dominance is now testing a major support zone for few days. A confirmed breakdown here could unlock significant strength for altcoins in the near term.
Chart Overview:
• Price has consistently made lower highs (LH) and recently printed a lower low (LL).
• After a failed bullish retest at 64.80%, it's back at the critical 64.46% support, which:
→ Aligns with the 0.382 Fibonacci retracement
→ Sits on top of a long-standing demand zone (marked in blue)
Bearish Continuation Bias:
• If this 64.46% zone breaks, the next downside targets lie at:
• 63.99% (0.5 Fib)
• 63.51% - 63.38% (0.618–0.65 golden zone)
• The yellow arrow path shows expected continuation in case of a confirmed breakdown.
What This Means for Traders: 📌
• A drop in BTC Dominance often coincides with altcoin rallies.
• A clean breakdown below 64.4% may fuel rotation from BTC into ALTs, especially in mid caps and L1 ecosystems.
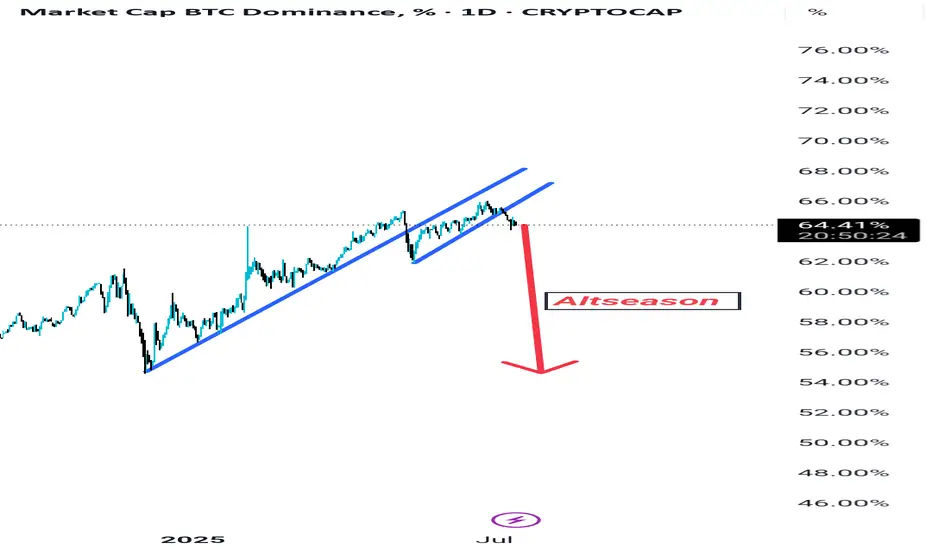
BTC DOMINANCE? Just wait few days guys It seems that Bitcoin dominance , after a long and exhausting uptrend, is finally showing signs of fatigue. The momentum appears to be fading, and a new downtrend has already begun. As you can observe, both the long-term and short-term trendlines have been broken on the daily timeframe, clearly indicating that Bitcoin dominance is shifting into a downtrend.
So, after waiting patiently for so long, hold on just a little bit more. A few more days of patience could change everything. Once dominance starts to fall, the altcoin index will rise, and your favorite altcoins will begin to pump rapidly.
Don’t lose hope. Stay alert. The tides are about to turn in your favor.
Yes, I agree—this time Bitcoin dominance tested everyone’s patience far more than usual. But that’s the nature of the market. It will always push you to your limits, make you sell at a loss, and then move exactly where you expected it to go.
BTC Dominance – History Repeating? Altseason 2025 Loading? Hey Traders!
If you’re finding value in this analysis, smash that 👍 and hit Follow for high-accuracy trade setups that actually deliver!
This chart is SCREAMING for attention 👀
We’re at a critical inflection point on the weekly BTC Dominance chart — and if history has taught us anything, it’s that altseasons are born when dominance collapses from resistance.
🧠 Key Observations:
🔺 Macro Resistance Trendline:
Rejected in 2017 → Altseason 🔥
Rejected in 2021 → Altseason 🔥
Now (2025?) — BTC.D is again touching this same red trendline...
🟢 Support Trendline:
BTC.D formed a clean long-term support from which previous dominance drops have bounced — currently lining up around 42–45%.
📉 Previous drops after rejection:
2017: –50.79%
2021: –45.10%
2025 projection? –36.91% (which would bring us to the same support zone again)
🟡 What It Means:
If BTC.D gets rejected from this resistance again, it could mark the start of the long-awaited Altseason 2025. A breakdown from this wedge would likely result in capital rotation from BTC into altcoins — just like in previous cycles.
🔍 What to Watch:
A confirmed rejection from this red resistance line
Drop below the yellow wedge support
BTC sideways / ETHBTC strength = green light for ALTS
💥 This could be the altcoin opportunity of the next couple of years.
Conclusion:
All eyes on BTC Dominance — because when it falls, altcoins usually FLY.
📊 Stay updated, stay ready.

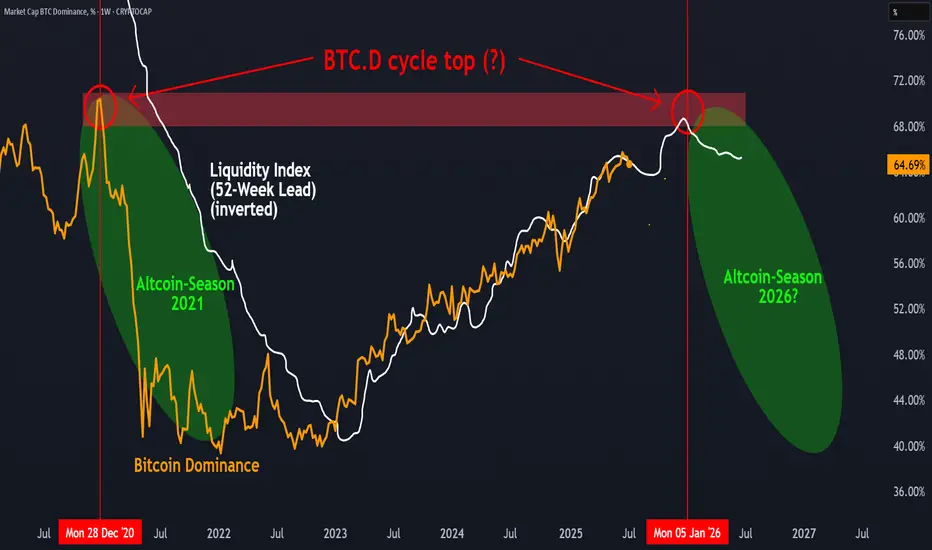
BTC.D Cycle top in?There are signs that Bitcoin Dominance (BTC.D) could be leaving a cyclical top, similar to what we saw in late 2020. When overlaid with the Global Liquidity Index (inverted and leading by 52 weeks), a potential correlation appears: previous peaks in liquidity were followed by turning points in BTC.D about a year later.
If this pattern repeats, a shift in market dynamics — possibly in favor of altcoins — could unfold over the coming year. However, this remains a hypothesis rather than a confirmed signal. The relationship between macro liquidity and crypto sector rotation is worth watching, but it’s not guaranteed to play out the same way again.
What’s your take: Altcoin Season loading or not yet?
BTC.DShort term alt-season, as every loses their minds.
Grand finale of the major markets should result in serious FOMO on crypto.
