BTC.D about to dropBTC.D weekly upward trend has broken down. It’s currently testing previous support as resistance, once its finished testing the resistance it will crash. IMO, ALT season could start any day now.
BTC.D trade ideas

BTC.D When ALT season?BTC Dominance (BTC.D) – Updated Technical Outlook
The BTC Dominance chart reflects Bitcoin's performance relative to the altcoin market. Here’s an analysis:
Key Levels and Observations:
1. Resistance at 58.47% and 61.31%:
- BTC.D attempted to breach the 58.47% resistance but faced rejection, leading to a pullback.
- The 61.31% level, marked as a key Fibonacci retracement, remains a significant hurdle for further upside momentum.
2. Support at 55.76% and 54.57%:
- The first notable support lies around 55.76%, aligning with a historical horizontal support zone and the yellow trendline.
- If this level is breached, the next support at 54.57% may come into play, potentially leading to increased altcoin strength.
3. Trendlines and Channels:
- BTC.D continues to respect the rising yellow trendline, indicating that the long-term bullish trend is intact.
- The dotted red channel lines act as a dynamic resistance zone for future attempts to reclaim dominance above 60%.
4. Volume Trends:
- Volume levels show declining momentum during the recent pullback, which could indicate temporary weakness rather than a full reversal.
- A volume breakout above 58.47% would confirm renewed dominance for Bitcoin.
5. Long-Term Perspective:
- BTC.D has maintained a higher-high, higher-low structure, suggesting bullish market sentiment for Bitcoin dominance over the medium term.
- However, consolidation between the 55.76% and 58.47% range could signal indecision before the next significant move.
Potential Scenarios to Watch:
1. Bullish Scenario:
- A breakout above the 58.47% resistance would open the door for BTC.D to challenge the 61.31% level.
- Sustained dominance above 61.31% would likely indicate Bitcoin outperforming altcoins across the board.
2. Bearish Scenario:
- If BTC.D loses the 55.76% support and breaks below the rising trendline, it could shift momentum in favor of altcoins.
- Key downside targets would then include 54.57% and the stronger support zone at 52.97%.

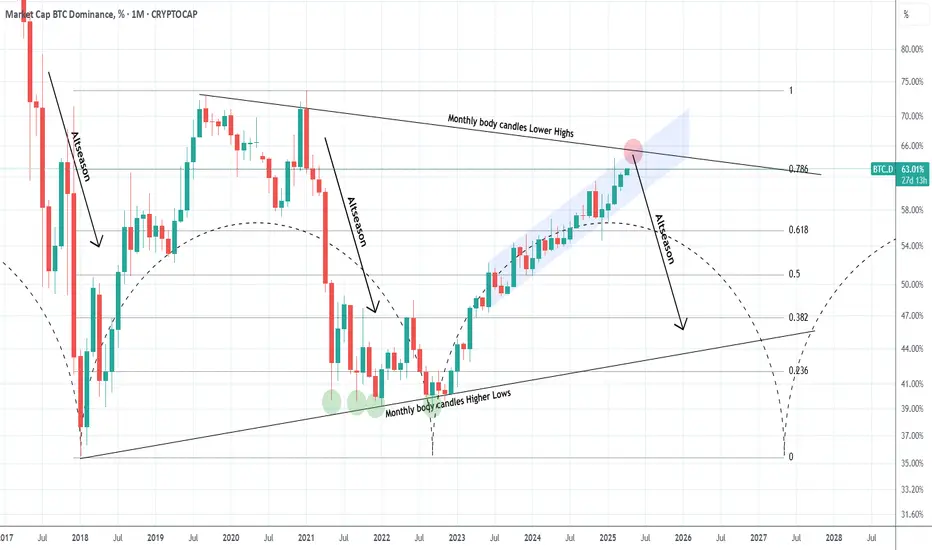
Is BTC Dominance about to reverse and start an Altseason?Well its undoubtedly what the crypto investor wants and what the market would have technically given in February if it wasn't for the tariffs trade war. Bitcoin's Dominance (BTC.D) is trading within a Triangle and February's test of the 0.786 Fibonacci retracement level was the technical level that should have given a rejection.
That rejection technically starts the Altseason which was dominant via a Bearish Leg both in 2017 and 2021. So far though both February's and March's 1M candles closed below the 0.786 Fib and April has an opportunity to even test the monthly body candles Lower Highs, which is the top of the Triangle. This is the last level that a rejection can be technically given.
Can this start an Altseason?
-------------------------------------------------------------------------------
** Please LIKE 👍, FOLLOW ✅, SHARE 🙌 and COMMENT ✍ if you enjoy this idea! Also share your ideas and charts in the comments section below! This is best way to keep it relevant, support us, keep the content here free and allow the idea to reach as many people as possible. **
-------------------------------------------------------------------------------
💸💸💸💸💸💸
👇 👇 👇 👇 👇 👇
BTC Dominance Monthly Chart🪙BTC Dominance Monthly Chart
It seems like it will still take a long time for altcoins to potentially recover.

BTC DOMINANCE in Rising wedge Pattern BTC Dominance Showing Signs of Weakness – Altseason Incoming?
BTC dominance is finally topping out, displaying clear signs of weakness. Rising wedge Pattern forming on weekly time frame which is also bearish. Despite reaching new highs, momentum appears to be fading, with bearish RSI divergence further confirming the exhaustion. All indicators point towards an imminent breakdown in BTC dominance, potentially triggering a long-awaited Altseason in the coming days. Stay prepared for major moves in the altcoin market!
1. Weakness in the uptrend =Bearish
2. Rising wedge Pattern = Bearish
3. RSI divergence on weekly = Bearish
All things indicating towards upcoming Bearish trend for BTC Dominance.
What do you think share your thoughts in the comments.
🚀 🚀 🚀 🚀
This is not a Financial Advise

BTC Dominance Chart Analysis. 50-day MA: 61.94% (Notable Support Level)
200-day MA: 59.21% (Strong Support)
Trend: The chart shows a bullish trend in BTC dominance since the beginning of the year, with higher lows forming.
Resistance Level: A key resistance area lies around 63%, which the price is currently testing.
Support Level: The 50-day and 200-day moving averages provide solid support below current levels.
Update Points
Short-term outlook: If BTC dominance stays above 62%, it could reach 63% resistance.
Long-term indicators: Continued support at the moving averages suggests bullish sentiment if BTC can maintain its position.
Market Conditions: Monitor fluctuations in altcoin performance, which could impact BTC's dominance positively or negatively.
If you found this analysis helpful, hit the Like button and share your thoughts or questions in the comments below. Your feedback matters!
Thanks for your support!
DYOR. NFA

Update BTC D I was hoping to find a loophole for Bitcoin's takeover in the next few days, but I believe we have three months of dominance ahead of us, and I don't know if the currency will fall further or maintain its support. It seems that dominance is rising to the 73% level, after which the bull run will begin.
So, be patient over the next three months.

Alt Season Alert?Bitcoin dominance looks to be reaching its bounds and with all the talk about Bitcoin dominance gaining even more it seems we are at the top of Bitcoin dominance.

BTC.D There is no sign of Bitcoin dominance falling and it will likely move towards 70-73% without interruption...

Altseason is coming Altseason is coming soon than your expectations. Expecting Btc.d to dump from current price areas and and alts starts gearing up.

BTC Dominance is Bullish (4H)On the chart, we have consecutive trigger lines that have been broken, and after the SW L, we see a bullish iCH and higher Ls, which are bullish signals.
However, considering the Bitcoin dominance chart, buying altcoins or taking long positions on altcoins is risky. It is better to look for short setups on altcoins instead.
Targets are marked on the chart.
The closure of a 1-day candle below the invalidation level will invalidate this analysis.
For risk management, please don't forget stop loss and capital management
Comment if you have any questions
Thank You

bitcoin domEveryone get so mad when I said that I expect BTC to go for 95% dom. Oh, the hate and the vitriol. It was so bad, that tradingview moderators deleted comments, because they were so salty. Guess what guys, I was right. I am right, and you’re about to find out. I don’t understand why it’s so hard for people to understand. It’s just basic candles and chart formation. If you can’t see a 95% test coming, should you be investing in the stock market. I’m just asking. Maybe you’re not cut out for this.

BTC Dominance V/S Other ALT Coin DominanceA comparative weekly analysis of Bitcoin Dominance (BTC.D) and the dominance of altcoins excluding the top 10 (OTHERS.D).
Key Observations:
Left Chart (BTC Dominance - BTC.D)
Current Level: 62.88%
Resistance: Around 63.09% (marked by a red line and arrow)
Previous Support: 60.17% (red horizontal line)
Trend: BTC dominance has been rising and is approaching a major resistance zone.
RSI: 66.35, showing bullish momentum but nearing overbought levels.
Bearish Divergence in RSI: The RSI has shown lower highs while price made higher highs in the past, indicating potential weakness in the trend.
Right Chart (Altcoin Dominance - OTHERS.D)
Current Level: 8.19%
Demand Zone: Highlighted in yellow (around 6% - 8%)
Trend: Altcoin dominance has been declining and is now approaching a strong demand/support zone.
RSI: 36.15, indicating oversold conditions and a possible bounce.
Possible Market Implications
If BTC.D breaks above 63%, it could signal further Bitcoin dominance, leading to more capital flowing into BTC rather than altcoins.
If BTC.D gets rejected at resistance, we might see a rotation of capital into altcoins, leading to a bounce in OTHERS.D.
OTHERS.D is at a demand zone, meaning a reversal could be imminent if buyers step in.
The RSI on BTC.D suggests caution as it nears overbought levels, while RSI on OTHERS.D suggests a possible bounce.
Potential Strategies
For BTC holders: Watch for rejection or breakout above 63%. A rejection may lead to altcoin season.
For Altcoin traders: A bounce from the demand zone in OTHERS.D could be a good entry point for altcoins.
For Market Neutral Traders: Look for BTC dominance rejection signs and altcoin strength confirmation before rotating capital.
Would you like further insights or an updated analysis? 🚀

#BTC Dominance: This is when ALTS will start Rallying!!BTC Dominance Update by Cryptorphic
🚨 Crossover Alert 🚨
Looking at the current BTC Dominance chart, we can see that the 21 WMA (Blue) and the 50 WMA (Red) are moving almost parallel to each other. A key moment to watch for is when the 21 WMA crosses below the 50 WMA. This will be a strong confirmation of a potential trend reversal.
🔴 Historical Context:
- The previous crossover led to a significant drop in BTC dominance, triggering altcoins to rally.
- The current market structure shows BTC dominance at a crucial resistance level. We are looking for a possible rejection at this level, which could signal an entry point for altcoins.
📈 Price Action:
- BTC Dominance is currently testing the upper boundary of the rising channel.
- A rejection around 64.25% to 65.66% is expected, and the best entry for altcoins would likely come on that rejection.
🚀 Next Move:
Keep an eye on the crossover between the 21 WMA and 50 WMA for confirmation. A downward crossover will likely signify the start of a broader altcoin rally.
If you like this update, please support it with your likes and share your feedback/requests in the comments section.
Thank you
#PEACE

BTC Dominance Breaks Out Altcoins Set to Bleed, Be CautiousHey everyone, let’s dive into this BTC Dominance chart on the 4H timeframe. As you can see, BTC Dominance has just broken out to the upside from a descending triangle pattern, which is a bullish signal for dominance. Currently sitting at 62.633%, it’s testing a key resistance zone around 62.71% (the recent high). If this level holds as support, we could see BTC Dominance push higher toward the next resistance around 64-65%, a zone that aligns with the upper trendline of the longer-term ascending channel.
What does this mean for altcoins ?
When BTC Dominance rises, it typically signals that Bitcoin is outperforming altcoins, often leading to altcoins bleeding in value relative to BTC. The breakout suggests capital is flowing into Bitcoin, likely due to market uncertainty or a flight to safety within crypto. Altcoins could face downward pressure in the short term, especially if BTC Dominance confirms this breakout with a strong close above 62.71%.
Key Levels to Watch
Support: 62.62% (recent breakout level) – if this fails, we might see a retest of 61.5%.
Resistance: 64-65% – a break above this could accelerate altcoin underperformance.
Invalidation: A drop below 61.5% would negate the bullish setup for BTC Dominance and could signal a potential altcoin rally.
Altcoin Outlook
Altcoins are likely to struggle in the near term as BTC sucks up market liquidity. However, keep an eye on major altcoins like ETH, BNB, or SOL for relative strength – if they hold key support levels despite this dominance move, they might be the first to recover when BTC Dominance cools off.
Final Thoughts
This BTC Dominance breakout is a warning sign for altcoin holders. Consider tightening stops on altcoin positions or hedging with BTC exposure. Also don't forget this is NFP Week as well. Let’s see how this plays out over the next few days – stay nimble and trade safe!

Altseason 2025 is upon us *A different take*Welcome back dearest reader,
I've been covering some altcoins i'm bullish on, and a deeper dive into bitcoin dominance is key for their succes. Well the downfall of the dominance that is.
On the chart:
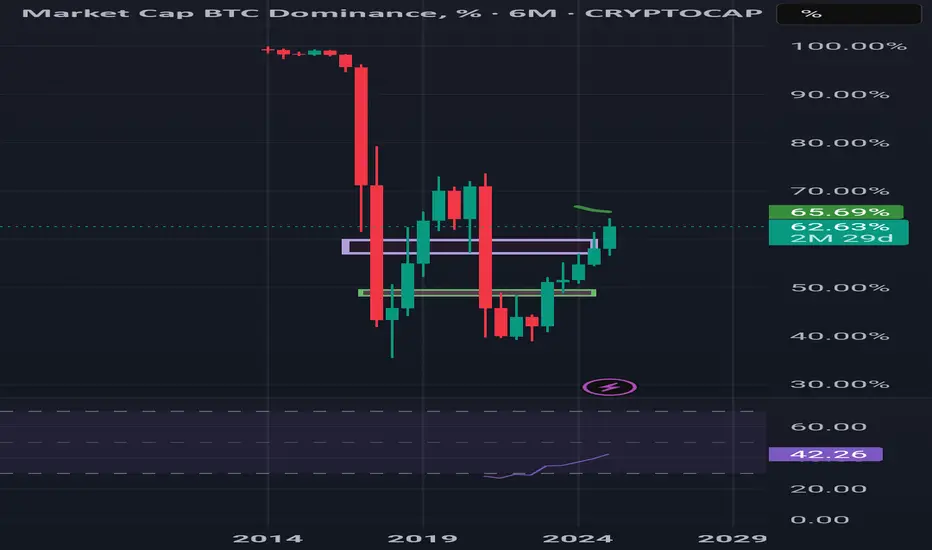
~The fibonacci extension has shown gradual weakness throughout the cycles starting at the 1.618 then the 1, now the 0.786 is inbound. I expect it to be hit soon topping at around 66% dominance. We can see what happened next ''1''
~MFI is hitting an oversold zone like never seen before on the 3 month ''2''
~Stoch RSI is hitting an oversold zone and is bound to see a cross ''3''
Load up on your favourite alts and enjoy the ride.
~Rustle

BTC Dominance: We Warned You And It's HappeningHello, Skyrexians!
A lot of hating comments we received under our recent CRYPTOCAP:BTC.D analysis. Now we sure that market always go against the crowd. This is the super valuable experience and we want to say thanks to all haters. Now let's update this idea, try to understand the structure on the wave 5 drilling into lower time frame.
Let's take a look at 12h time frame. We can see that after the spike in the wave 3 price retraced with the ABC zigzag and started the new wave 5. Waves 1 and 2 inside this wave have been finished. Wave 2 reached exactly 0.61. Now we can measure wave 3 target. 1 and 1.61 are the potential target. The most realistic one is 64.7%. Then we expect the wave 4 and the last leg up into subwave 5. Always look at the divergence on the Awesome Oscillator to measure the trend end.
Best regards,
Skyrexio Team
___________________________________________________________
Please, boost this article and subscribe our page if you like analysis!

#BTC DOM whe. Btc dominance will reach 65% btc really will comWhen btc dominance will reach 65 % btc rally will completed
After that altcoin will create facking bull run
This is the biggest bearish divergence I have seen in my lifeBeen forming for a few months now. We don't know if it is going to play out soon but the macd valleys make it very clear.
My assumption is that we are going to fill the candle wick left weeks ago and then going down to a stable level.
I don't think it will start an altseason as there is still plenty of room and time for BTC to rise and when Dad is doing its thing you know the children can't go out and play

Strong as ballistic missile Forgot green market and short position is remedy. It takes much time having bullish market.

Bitcoin dominanceWith all being said bitcoin, dominance has been on very significant rally throughout the years and coming to a point where we will have to see a reversal sooner or later my guess is sooner.

BTC Dominnace: The Real Disaster is Here!🚨 BTC Dominance: The Real Disaster is Here! 🚨
Bitcoin Dominance (BTC.D) has officially confirmed its uptrend, breaking through key resistance levels and heading toward the upper zone. The next major stop? **The black zone**—a crucial area that could dictate the fate of the market.
🔥 What This Means for Altcoins 🔥
With BTC dominance on the rise, liquidity is shifting heavily into Bitcoin. Historically, this scenario has spelled **bad news for altcoins**—any hopes for an "Altcoin Season" could be fading fast. If this move continues, many altcoins could suffer heavy losses in BTC pairs.
💡 Key Takeaways for Your Trades 💡
✅ Be cautious with new altcoin entries—risk is high.
✅ Keep an eye on **Bitcoin's price action**—a strong BTC move can further crush alts.
✅ **Risk management is key**—don’t overexpose yourself to high-risk plays.
✅ If BTC.D continues to climb, expect further dominance over altcoins in the coming weeks.
🚀 Final Thoughts 🚀
We’re at a critical moment—stay vigilant and adjust your strategy accordingly. Pay close attention to your new buy trades, as market conditions could shift rapidly.
What’s your game plan? Let’s discuss it in the group! 📢👇

Mid-February, Btc.d peaks and the altcoin rally may start.Trust fibonacci.
It is clear from Fibonacci extensions that we are close to the peaks in Bitcoin dominance.
Fibonacci circles also give us ideas of both resistances and time periods.
In my opinion, Bitcoin dominance will peak in mid-February and the altcoin bullrun may begin. Bitcoin dominance will bottom at the end of May 2026.
* What i share here is not an investment advice. Please do your own research before investing in any digital asset.
* Never take my personal opinions as investment advice, you may lose all your money.
