BTC DOMINANCE roadmap (W)After the sharp drop that Dominance had, we had a bullish iCH at the bottom of the chart, after which Dominance is filling this IFC move by hitting higher Ls.
Upon reaching the resistance range, we expect drop candles
The targets are marked on the chart
Closing a daily candle above the invalidation level will violate this analysis
Comment if you have any questions
thank you
BTC.D trade ideas


BTC.D ALERT ***Considering this pattern that I have derived from the past market and the astonishing similarity
of the current price movement with the past, it can be expected that this pattern will
complete.
.....................................................................................................................
.....................................................................................................................
.....................................................................................................................
.....................................................................................................................
Conclusion :
If this occurs, a rapid and attractive alt season will take place
.....................................................................................................................
.....................................................................................................................
Wishing you successful & be profits 💲🔥
.
.
Risk and capital management 🚨

Bitcoin Dominance Likely to Drop – Key Levels to WatchBitcoin dominance is showing signs of weakness and may be heading for a drop. The dominance chart suggests a potential reversal as key resistance levels are being tested and rejected.
Should monitor price action closely. If BTC.D falls further, altcoins might experience a strong relief rally. Stay prepared!

$BTC.D bearish but the result is disapointing for alts.📉 CRYPTOCAP:BTC.D Turning Bearish
CRYPTOCAP:BTC.D is overbought and starting to turn bearish. Influencers are hyping up an alt season, but don’t fall for the FOMO.
⚠️ Reality Check
✅ CRYPTOCAP:BTC.D dropped 2%, but altcoins barely moved.
✅ A small pump happened, but retail investors are not buying in.
✅ Many alt holders are selling to avoid further losses.
💰 Where's the Money Going?
🔻 CRYPTOCAP:BTC dominance is decreasing, but funds are flowing into CRYPTOCAP:USDT and stocks, not altcoins.
📊 Technical Outlook
🟢 MACD & RSI indicate some potential in strong altcoins.
🚨 A flash crash in CRYPTOCAP:BTC could wipe out altcoin gains.
🔴 Major resistance at 60% may trigger a bounce, keeping alts suppressed.
📈 If the descending channel breaks upward, CRYPTOCAP:BTC.D could hit 64%, leading to a 20%+ crash in altcoins.
🛑 Trading Strategy Recommendation
✔️ Day trade: Buy support, sell resistance, target 5-10% gains 📈
✔️ Avoid leverage: Too risky in this market ⚖️
✔️ Monitor MACD, RSI, and economic news for signals 📰
❌ Holding is NOT recommended in these choppy conditions. Be cautious, take profits, and stay ahead of the game. 🚀

BTC.Dbtc.d scenario, can it break the top line in the past? This is not trading advice, it is best to do your research first before starting to trade

BTC.D - Bitcoin dominance about to fall hard ?Violet bars pattern is move from 4 years ago
as you can see its copying it right in term of time and price action, not exactly in term of price but proportionnal
those blue trendlines converging to the same point indicate btc.d might have made a local top
all of these above indicate that we are picking and alt season will start, with a big acceleration in 2 weeks when we go below 60%
you can expect bounce from there for bitcoin or 94k6 then we should be fine
target for btc dominance is just the fib
58%
55%
49%
45%
39%
as btc.d seems to react less to volatility this year, theres a chance we dont go to the lowest fibs
Cheers

Double Top in the Making???If dominance of btc manages to raise to the top of the channel, it will be around the last blow off top, forming a potential double top to end the bull market for BTC.D, but it’s only a possibility.

BTC.D% my notes for short-termThe negative scenario could be that the dominance tries to create a double top or take 50% of the upper wick. If it does this, it will try quickly, in this scenario we can have a heart attack. These levels are: 61.3 - 62.7 - 63.5 and 64.5.
In the positive scenario, the dominance will rise to 61.3% at most and fall down quickly. A drop to 56% and 58% below could create nice recoveries for altcoins in the coming weeks.
In the short term, these are the possibilities I expect in the coming days/weeks and the price levels I follow.
This is not investment advice.

Was 64% the top, or is there more downside coming for altcoins ?Hello Traders 🐺
In my last idea, I discussed the potential short-term pump for altcoins, which you can check out here: 👇
As you can see in the chart above, BTC.D dropped exactly as I predicted—so congratulations to all my dear followers who took advantage of it!
But what now?
Despite the recent dumps in the market, I still strongly believe that 64% was the top for BTC.D. Let me explain why:
1️⃣ The chart shows a rising wedge pattern, which is typically a bearish formation.
2️⃣ If BTC.D moves higher again, in my opinion, it could form a double top, making the chart look even more bearish!
3️⃣ Most altcoins are currently experiencing a severe decline, but in the past few days, ETH has shown slight outperformance over BTC, which is a bullish sign.
4️⃣ Always remember that technical analysis is about learning from history and acting accordingly. So far, we have never seen a bull market peak when BTC.D is at such a high level, and the Altcoin Season Index is still around 30%.
I hope you enjoyed this idea!
🐺 Stay sharp, trade smart! – KIU_COIN 🐺

It's Looking Like a GW Failure COINBASE:BTCUSD
Looking like a GW failure for BTCD. I don't expect it to re test the upper 1:0.618 channel.
With that shooting start though the 2.272; Could be down from here for a little while.

Bitcoin Dominance Bullish EW = No More Alt SeasonBitcoin Dominance seems create EW and will go to final phase of wave 5
if this happen altcoin especially meme will rug hard
and no alt season ahead
this cycle is different
Bitcoin driven by ETF volume, no retail volume

BTC.D ON DAILY CHARTCRYPTOCAP:BTC.D
on daily chart the bitcoin dominance continues to put significant market pressure and still on uptrend line.
we has a very strong resistance at 62% and I don't think it's easy to overcome, maybe it's the last breath.
Lets wait and see what happen soon , but in any case, in the event of a rebound and not exceeding the resistance, we will have support at 59% and 58%, and it must be broken to see a recovery in the market .
waiting..

Reality SlapI’m here to slap those calling for alt season since 2023. Yes, you deserve a big fat slap for calling for something that hasn’t happened yet. I’m guilty of calling for alt season without seeing any signs myself. You only need one indicator to tell you that we are in alt season and that’s when BTC.D goes and closes below 150 EMA on the weekly chart. For now the dominance is far above the150 EMA and we can all bark about alt season, but it’s not going to happen until we get a close below the 150 EMA.

btc dominance & altseasonBTC dominance its repeating the previous cycle. Dominance will drop soon.
It makes a reversed bullflag (bearish), if the dominance drops Altseason begins.
We need a correction in dominanceFor the pump, we need the dominance to correct and I think it’s going to be .

BTC.D has not topped out yet vol.2In case you missed december 16th post there it is
After 2 months BTC.D still in uptrend.
Previous resistance is acting like support right now.
RSI is trending higher (formed higher low) and StochRSI has strong momentum upside.
BTC.D is not Topped. It is still going higher in coming WEEKS. So we must expect for big opportunity to buy altcoins at 50-60% discount from current prices.
I believe that this incoming crash must be the last one.

Bitcoin Dominance Analysis Channel Rejection and Its Impact Bitcoin Dominance is currently trading within a well-defined downward channel, indicating a consistent decline over time. Recently, dominance attempted to break below the channel but failed, resulting in a re-entry back into the channel. This failed breakdown suggests that the bearish momentum is weakening, at least temporarily.
A declining Bitcoin dominance typically signals a potential bullish phase for altcoins, as market capital moves away from Bitcoin into alternative cryptocurrencies. However, in this scenario, the downward movement is relatively slow, confined within the channel, which explains the lack of a strong recovery in the altcoin market.
For a more significant altcoin rally, we need to see a clear breakdown of this channel, accompanied by a sharper decline in dominance. A rapid drop would likely trigger stronger buying activity in altcoins, providing better opportunities for traders.
It's crucial to monitor Bitcoin dominance closely, as its next move will provide key insights into potential market shifts. Stay alert and adjust your trading strategy accordingly.
If you find these market insights helpful and want to stay updated with more trade setups and detailed analysis and join my community,feel free to ping me.

Altcoin Season is imminent!Hello Traders 🐺,
As you can see in the chart, I’ve included all the key information, but let me break it down for you more clearly:
1️⃣ We have never seen the RSI reach this level on the monthly BTC.D chart before! This looks extremely bearish for BTC.D and highly bullish for Altcoins!
2️⃣ As you might know, every time we see a golden cross in TOTAL2 (which represents the Altcoins’ market cap excluding BTC), it signals the beginning of Altcoin season. The exciting part? This golden cross is happening exactly when BTC.D is at its high percentage levels , making the setup even stronger!
🐺 Stay sharp, trade smart! – KIU_COIN 🐺

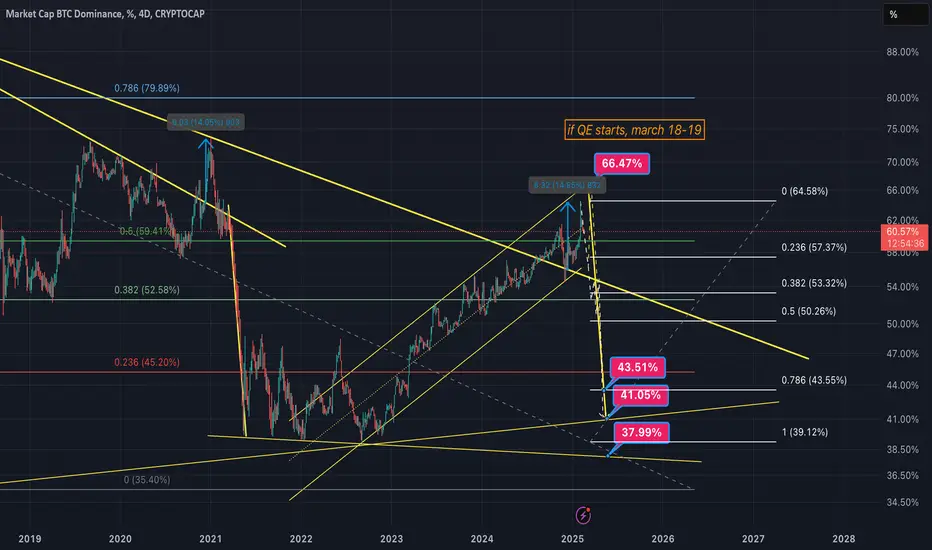
$BTC.D and $DXY are in diametrically opposite directionsIn this blog space we have been discussing Bitcoin Dominance ( CRYPTOCAP:BTC.D ) since Dec 2024. On 9th Feb 2025 I posted a blog where we discussed the Fib Retracement levels in CRYPTOCAP:BTC.D chart and we said that we can expect more upside and has broken past 0.618. I said it is possible that the dominance can reach the 0.786 Fib level at 66.12%.
I tried to plot the Dollar index TVC:DXY in the same weekly chart as CRYPTOCAP:BTC.D and it was quite surprising that the FIB retracement levels in CRYPTOCAP:BTC.D are the same as the top to the bottom levels in the TVC:DXY chart. We are looking at the last 5 years for our analysis.
When CRYPTOCAP:BTC.D has broken past 0.618 Fib level and trying to reach 0.786 @66.12%. But the TVC:DXY has broken below 0.786 and in the near term the TVC:DXY level can end up at 0.618 Fib levels which can take TVC:DXY to 104.
So, in the near to medium term is CRYPTOCAP:BTC.D @ 66.12% and TVC:DXY @ 104.

ETH/USDT 1H: Momentum Strong – Can Bulls Break $2,820?!"ETH/USDT 1H: Momentum Strong – Can Bulls Break $2,820?"
🚀 Follow me on TradingView if you respect our charts! 📈 Daily updates!
Market Structure & Momentum:
Price: $2,734, showing strong momentum after breaking key resistance.
RSI at 64.50, confirming bullish momentum but not yet overbought.
Clear bullish structure, with higher lows forming.
Hidden bullish divergence confirmed on RSI, supporting continuation.
Key Levels:
Resistance: $2,780 (major supply zone).
Support: $2,680 (previous resistance turned support).
Fair Value Gap (FVG): $2,600-$2,620 range.
Trading Strategy:
Entry: Current price ($2,734) or pullback to $2,700 for better risk-reward.
Targets:
T1: $2,820 (+3.1%).
T2: $2,860 (+4.6%).
Stop Loss: Below $2,645 (-3.2%).
Risk Score:
6/10 – Momentum is strong, but price is nearing major resistance.
Smart Money Analysis:
Accumulation visible at the $2,600 zone, confirming institutional interest.
Market Makers likely targeting liquidity above $2,800.
Strong institutional buying pressure evident from the volume profile.
Recommendation:
Longs remain favorable, but watch for potential resistance at $2,780.
Keep tight stops below $2,645 in case of rejection.
Break and hold above $2,780 confirms strength for a move toward $2,860.
Confidence Level:
8/10 – Bulls in control, but price must clear $2,780 resistance for extended upside.
🚀 Follow me on TradingView if you respect our charts! 📈 Daily updates!

BTC.D weekly chartCRYPTOCAP:BTC.D
Is the 2017 scenario repeating here? I think it is the most likely, the price reached an important resistance.
We also have a negative weekly candle at the resistance and tomorrow is the close.
So, all the data says that the takeover should fall from this area.
Let's observe and see behavior after the weekly close.
waiting .....

BTC Dominance Drops: Is the Alt Season About to Begin?Hello, Traders!
After its recent rise to 64%, BTC.D started to decline slowly and currently dropped below 61%.
In order to resume alt season, BTC.D needs to drop at least below 57% and hold below that mark for a prolonged period of time.
Ideally, it should break below 54% to make a lower low and confirm a sustained downward trend.
Historically, when BTC.D enters a clear downtrend, liquidity flows into altcoins, leading to significant rallies across the board.
I don’t think that even if the alt season really takes off, we will see BTC.D much below 48%—perhaps 45%, but not lower.
At that level, the market typically starts rotating back into BTC, capping further dominance declines.
However, if BTC stagnates while liquidity continues flowing into alts, a deeper drop isn’t entirely out of the question.
One of the potential catalysts for a BTC.D decline and the start of the alt season is Ethereum’s upcoming Pectra upgrade.
Historically, ETH has shown strong performance ahead of major network upgrades, often doubling in price in anticipation.
If history repeats itself, we could see increased demand for ETH, driving capital into the broader altcoin market.
The Pectra upgrade is scheduled for April 8, meaning we might see altcoins gaining momentum in the next couple of weeks.
If BTC remains stable and ETH starts outpacing it, this could create the perfect conditions for the much-anticipated alt season.
Keep an eye on ETH/BTC as well—it could serve as an early indicator of the shift. 🚀
Please don’t forget to boost this idea and leave your comments below.
