Bitcoin Dominance: Elliott Wave and Harmonics Combo (Part 2)MARKETSCOM:BITCOIN Dominance ( #BTC.D / CRYPTOCAP:BTC.D ) indeed started the rise I predicted back in late '22. CRYPTOCAP:BTC rose to the limits, exceeding the 100K Mark.
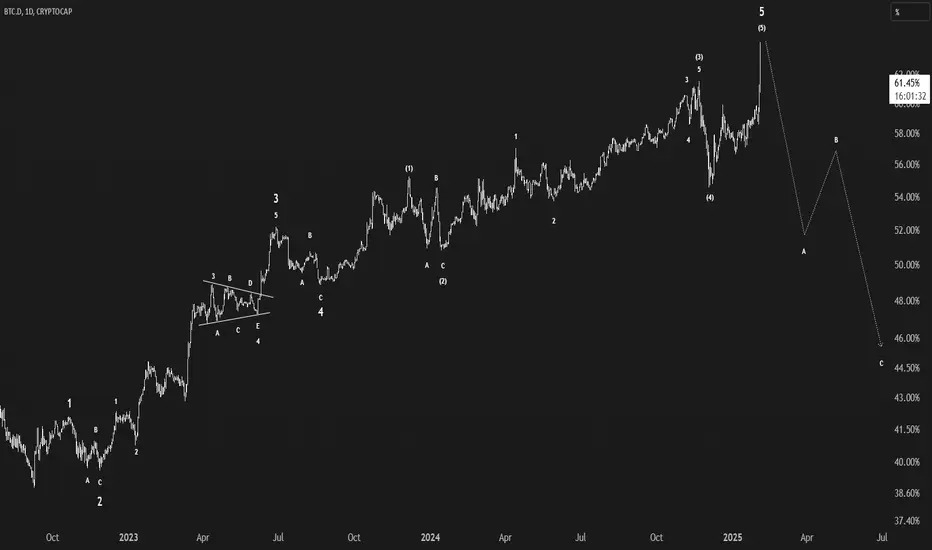
In #ElliottWave, this is Cycle Wave C (turquoise).
Primary Wave ① (white) completed, with the Corrective Primary Wave ②now in play.
The Correction will pave the way for Alt Season to commence, so the focus will shift to Alt Coins.
#Harmonics are showing #Cypher Patterns, a combo actually, on different degrees.
Bitcoin Dominance ( BTC.D ) Technical Analysis:
* Elliott Wave Impulse: Cycle C (turquoise)
* Harmonic Patterns: Bullish Cyphers
* 88.6% Fibonacci Retracement
* Break-Out with Divergence
* Leading Diagonal in Primary Wave ① (white)
Conclusion:
After a last rise, expecting MARKETSCOM:BITCOIN to top-out and start a Larger Correction.
Alt Season to start and deliver, based on #BTC losing ground.
After this, CRYPTOCAP:BTC to continue ruling, as the one and only #Cryptocurrency.
BTC.D trade ideas

BTC Dominance Top > Altcoins Outperformance Next (ALT SEASON)The end for BTC and the beginning of the great rotation. Targeting 40% representing 800B in capital flows at the current market cap.

Weekly BTC.D expectation ahead! Hi fellow traders, BTC.D will be completing a weekly corrective pattern in the upcoming weeks resulting in a move higher on various Altcoins. After the the structure is complete it will continue higher towards the blue box area. Good luck and trade safe!

REGULAR FLAT WEEKLY ETHI've been watching Bitcoin dominance (BTC.D) for a while now. For those who follow wave trading, a continued rise in BTC.D seems likely. If Ethereum (ETH) loses the **$2,100** support level, it could confirm another bullish impulse in BTC.D, with a target between **73% and 74%**, validating a **regular flat**.
What concerns me about altcoin charts, especially ETH, is the **lack of long-term bullish structure**. A prolonged increase in BTC.D, combined with a BTC drop, could push ETH below **$900**. While this scenario might seem unlikely, it would be **technically clean** from a chartist perspective. It would represent a **wave C** of a **regular flat on the weekly timeframe**, setting up a potential **new all-time high (ATH)** afterward.
This reversal would correlate with a drop in BTC.D to **35% minimum**, which could trigger a strong altcoin rally.
**Summary:**
🔹 **As long as ETH holds $2,100 → No worries**
🔹 **Below $2,100 → High risk of deeper correction**
🔹 **BTC.D towards 73-74% → Regular flat confirmation**
🔹 **BTC.D dropping to 35% → Possible altcoin bull run**
Stay safe out there!

ALT SEASON IS COMING !#BTC.D made a huge rise last night the whole market made huge down spikes to the ground !
also we have a huge rising in USDT.D but now its bearish so when the liq is getting out of BTC and USDT too what will happen ?
it think this liq will go to altcoins and make them rise !

BTC.D Drop Drop of BTC.D to 50%
Potencial lining with overall lateral price lines.
Price is pushed to memory base.

Skyrexio | Historical Moment - Retail Altcoins Capitulation!Hello, Skyrexians!
Hope your deposits are alive. We warned you yesterday that Altcoins Dominance is weak and today it dropped significantly. Most of traders have average deposit drawdown -50-70% and this is capitulation dump. If price will bounce now they will definitely sell. This is psychology of weak hands, it's useless to argue with this. I (Ivan) personally bought all last 3 days altcoins with extra 40% of USDT which I have after last purchases in August 2024. Now I have 30% of stables. I am ready to be out of position for these money, but if I will be lucky the bottom is going to be catched.
Let's go to analysis. Weekly CRYPTOCAP:BTC.D time frame is showing that this week can be closed with the third red dow on Bullish/Bearish Reversal Bar Indicator . If this will happen we will finally see altseason. I wanna show you beauty of Elliott Waves. You can see that wave 3 reached the 1.61 Fibonacci level. Then wave 4 reached 0.5 retracement. It gives us extra confidence.
Final target of wave 5 could be already reached inside the 63-67% green box. Here we need to see the lower time frame to get the precise target.
Best regards,
Skyrexio Team
___________________________________________________________
Please, boost this article and subscribe our page if you like analysis!

Update the scenario for BTC.Dom - When might Altseason actually?Currently, BTC.Dom CRYPTOCAP:BTC.D is following the second scenario I mentioned in my previous post. This is the only scenario I can think of right now.
According to this scenario, I predict that from now until Trump's inauguration, it will remain quite challenging for Altcoins.
To determine whether Altseason will occur, it’s best to wait until the beginning of February to make an informed decision about deploying capital.
The image below shows instances of the M-pattern , where the second peak is higher than the first, followed by significant **Altcoin growth** in previous seasons.
If this second scenario doesn’t play out, my concern is that BTC.Dom could return to the 70 region. In that case, Altcoins would be completely crushed, and I truly hope this worst-case scenario doesn’t happen. :(

Bitcoin Dominance Flies As Alts DieAltcoins are riding the pain train to hell. As you can see, Bitcoin Dominance had one of its largest short term moves in history, spiking as high as ~64.50%. It is currently sitting at 61.71.%, as altcoins reel on the back of economic fears from Trump tariffs.
This is the highest level since 2020.
ETH dropped as much as 35% in a 24 hour period - proving I was very early to that trade. We will see if I was wrong in the coming months.
I bought more at $2,150. I also bought CRYPTOCAP:BTC , CRYPTOCAP:SOL and $SUI.
$2.2B was liquidated from crypto markets on leverage - the most in 24 hours ever. More than covid. More than FTX.
Crazy.
This cycle is playing on hard mode - be careful out there

The moment of truth for ALT SEASONBitcoin Dominance is nearing a very crucial level here at 63-64% and honestly i hope we see a rejection here and the decent starts as that could be the kickoff for alt szn.
As long as BTC.D is seeing upside momentum we'll see alts continuing to bleed which will create an EXTREME amount of fear within the bull market but perhaps thats exactly what we need before actually exploding to the upside?
I'm bidding heavily here as i think that many alts are heavily oversold and a reversal/alt szn is right in front of us but a lot will depend on the behavior of Bitcoin Dominance.
Bearish in BTC.D below 58% which imo could cause a lot more downside momentum aka an alt szn but for now the most crucial thing remains to reject 63-64% aka the golden ratio zone on higher timeframes.
Stay safe.
Nothing is financial advice.

BTCDOMThis is back in the zone
Sucks for us
If it continues up alts could see more blood and btc at 70k

Double Bottom Pattern: Bitcoin Total Domination Last week my post on Bitcoin dominance played out faster than it was expected.
(see related)
This indicator broke out into 60-70% area.
So, I switched to a weekly time frame and spotted a classic reversal pattern called "Double Bottom" in the making for you.
Let's break it down.
We have two bottoms highlighted with yellow arcs in the same area.
Indicator eyes the middle top between bottoms, it is called "Neckline"
Now, let's breakdown buying technique:
1) buy entry is at the breakout above Neckline (green dashed line)
2) stop loss is at the valley of the right bottom (red dashed line)
3) target is located at the depth of the right bottom from the Neckline.
in our case it can't be higher than 100% and is set at the maximum (blue dashed line)
Its amazing that technical analysis could predict things that out of our scope as yet.

BTC.D New Update (3D)First of all, pay attention to the timeframe; it’s a daily timeframe, and this analysis is time-consuming.
The subwaves of this index are numerous, even in higher timeframes, which results in multiple technical analysis scenarios. However, we always identify the most probable scenario.
Given the lack of a drop in Bitcoin dominance over the past weeks, despite losing the trendline, it can be inferred that the wave structure of this index is likely not yet complete.
From the bottom, we believe there is a double combination pattern, with both combinations appearing to be diametrics.
It seems that the primary peak of Bitcoin dominance will be within this red zone.
The waves have been marked on the chart.
Overall, it appears that this index intends to hunt a specific area before dropping. Let’s see what happens.
For risk management, please don't forget stop loss and capital management
Comment if you have any questions
Thank You

BTC.DI think wave 5 is complete. We are at the beginning of the altcoin season. I expect a drop of up to 44% in the ABC.
Finally btc.d touched it, Altseason is coming Hello guys, I was waiting for touching this zone about 3 month and finally it happened.
In my idea, dominance could fall from here and altseason is so close, so don't fear and buy the dips ;)

$BTC.D Short?It looks like BTC.D had its final push up and failed to breakout of its rising wedge. Altcoins saw a 25-35%+ decline in only a few hours which to me it looks like a final shakeout before liquidity pivots into ALTs. BTC.D has broken its 2 year bull run recently and failed to regain momentum.

This is the first cycle of the bull run that ended without an AlYou may have been expecting Altseason, but I have some bad news to share with you - Altseason is not happening, and at best, some altcoins might recover slightly in the next 2 months. However, due to the liquidity flow of ETFs, Bitcoin's upward trend will continue. I kindly request that new entrants refrain from buying altcoins."
Note: "Altseason" is a term used to describe a period of time when alternative cryptocurrencies (altcoins) experience significant growth and attention.

No Alts Season This Time.BTC.D looking ready to roll to the upside after breaking structure out of the channel and completing a re-test. Hopefully alts will get their turn in this bear run now.

Btc dominanceSeems like a double top to me , most alts rsi is below 18 on the 4hr that is crazy . I think market will bounce very soon specially alts . No way bears can keep up this selling pressure for alt coins

$BTC.D again above 60% After the tariff tantrum between US, Canda, Mexico and China during the weekend, we saw CRYPTOCAP:BTC again below 100K. But the weekly closure on the weekly chart in the CRYPTOCAP:BTC weekly chart is still not broken. So, the CRYPTOCAP:BTC bull run is still intact with short term hiccups.
But the topic of the discussion is not the CRYPTOCAP:BTC price instead we are looking at the Dominance chart. CRYPTOCAP:BTC.D is again above 60% even if CRYPTOCAP:BTC is below 100K. The Alt Coins have lost more Market Cap during this weekend’s shakeout in comparison to BTC. But it is highly coincidental that the CRYPTOCAP:BTC.D is back at the 0.618 Fib retracement level. The Fib retracement is plotted on the CRYPTOCAP:BTC.D weekly chart. There is no Alt Coin season unless the CRYPTOCAP:BTC.D breaks down decisively. Watch out if CRYPTOCAP:BTC.D weekly close breaks below the 0.5 Fib retracement level. Until then stay long $BTC.

BTC dominance Facing strong resistanceThis time BTC.D is getting away from its Ratio line, That is extremally bearish, Alt season is at our doors... BTC price may go up also, I think this time around is going to be a massive cycle for alt coins.
I am eager to watch the craziness we all know about alt season, It's the best time for a good meme, don't you think?
this is not financial advise, that is only my own opinion about the markets.

Crypto Market Dynamics Amidst Tariffs & Trade War FearsLast Friday afternoon, President Trump announced new tariffs on Canada (25%), Mexico (25%), and China (10%). This news set off a selloff in the crypto market. Since traditional financial markets were closed for the weekend, they couldn’t react immediately, but we might see panic selling when trading opens on Monday. In response, both Canada and Mexico have threatened retaliatory tariffs on the U.S. Whether Trump is using this as a negotiation tactic or signaling a long-term policy remains uncertain, but one thing is clear—the market dislikes the idea of a trade war.
On the bright side, Bitcoin was already due for a significant correction. Even a 30% drop from its current all-time high wouldn’t derail the Macro Trend. However, the concerning part is that Trump’s actions could lead to further economic pain for both the U.S. and global economies before any recovery happens.
Because so many factors are in play, I’ve combined four key metrics into one chart to help us see where money is moving. Here’s what the chart shows:
BTC.D (Candles): This indicates Bitcoin’s dominance in the market.
BTC Price (Orange): The current price of Bitcoin.
TOTAL3 (Purple): The total crypto market cap excluding BTC and ETH.
USDT.D (Green): This measures the share of funds in USDT.
What Does the Chart Tell Us?
Flow of Money: Funds are moving between Bitcoin, altcoins, stablecoins (USDT), or leaving the market altogether.
Key Indicator – USDT.D:
Below the Breakout Line: If USDT.D stays below a critical level, it suggests that buyers are stepping in to support both Bitcoin and altcoins.
Above the Local Top: If USDT.D breaks above its recent high, it signals increased market fear. In this case, we should watch the other metrics:
A spike in TOTAL3 indicates that altcoins are gaining traction, hinting at a potential altcoin season.
A spike in BTC.D suggests that Bitcoin is maintaining or even strengthening its dominance.
A spike in USDT.D implies that investors are seeking safety in stablecoins, showing overall market nervousness.
By monitoring these indicators, we can get a clearer picture of whether or not an alt season is developing, and whether the correction developing is a temporary setback or the start of a deeper decline.

BTC.D is getting another pump soonIt Could be even in berish market but I suggest Postions on BTC not in altcoins even ETH
