BTC.D trade ideas


$ALT SEASON$btc dom has been following this upwards trend for a while now and has teased us into thinking it’s going to fall by trading below the trend line.
i believe it will be rejected and start working its way down gradually following the path shown on the chart
this hasnt been confirmed yet but we will see more these next few weeks
i am bearish short term on btc and bullish longer term on alts

Bitcoin Dominance Makes Its Re-Test Perfect Today!Trading Fam,
Our retest here on the Bitcoin Dominance chart couldn't have gotten any more perfect. Does this mean that the altcoin/memecoin sell-off is finally nearing an end? Me thinks it does. And with Trump releasing his and his family's memecoins just days before his inauguration, this is a clear sign that he supports the market.
Of course, the TRUMP memecoin did suck millions in market cap away from other tokens, as traders arbitraged into the $TRUMP coin. But we could see a bit of a sell-the-news event on this token after his inauguration is complete. Then, traders may sell their profits and move back into older positions again. If you believe this as a possibility, it may be time to start picking up some of your favorite memecoins and alts again.
✌️ Stew

Will BTC Dominance do the same again?Comparison of BTC dominance in 2021 vs 2025.
2021 :
drop to the 23.6 level of the entire upward swing
rise to the 68.8 level of the local downward swing
drop to the 38.2 level of the entire upward swing
rise to the vicinity of the peak (or even reaching a local ATH)
drop to the 88.6 level of the entire upward swing
2025:
drop to the 23.6 level of the entire upward swing
rise to the 68.8 level of the local downward swing
Will the next moves follow the same pattern? We'll see in time:)

BTC.D Symmetrical Breakout BTC Dominance (BTC.D) on the 1-day chart has broken out of a symmetrical pattern to the upside, signaling strength in Bitcoin compared to altcoins. This breakout could lead to further dominance gains, especially if it holds above key resistance levels. It suggests a shift in market focus back to Bitcoin.

Bitcoin Dominance Breaking OutBitcoin dominance has broken above a descending trendline, currently sitting at 59.03%. This breakout suggests Bitcoin is beginning to absorb more market liquidity, a pattern often accompanied by altcoin underperformance. The next resistance lies near 59.92%, and a continuation above this level would confirm Bitcoin's growing market share. On the flip side, the breakout trendline near 58.5% now serves as immediate support. This shift in dominance reinforces Bitcoin's leading role in the market at the moment.
This is noteworthy considering the amount of liquidity that was sucked in the $TRUMP vortex. Altcoins are extra rekt for the moment.

There could be a title here. Very long and very tedious. That's what you can say about this chart.
But I like the fact that this week opened with a major signal that hasn't
been seen in a very long time.
The Kijun-sen line has crossed the tenkan sen from top to bottom and
the Kijun line is looking down.
The rise 2 years ago in January 2023 started from the opposite formation.
This is a weekly chart and things are moving slowly.
What else I've noticed about dominance behaviour. Purely subjective.
A 1-2 per cent drop down doesn't always give a visible revival to alts,
while a 1 per cent increase can take away a lot of health from them.
USDT.D and ETH.D probably play a role here.

BTC.D Bullish AgainThe big D is has broken out of downtrewnd while everyone’s calling for an alt season. There is not alt season when BTC.D is above EMA 150 and breaks out of a downtrend. Stick to holding and trading your bitcoin. At this point, nobody cares what the chart say. Everyone’s just following their feelings like a 12 year old girl. If you want to call for alt season, there needs to be signs of weakening dominance of btc. For that, the D must fall below the EMA 150 and break down below the downtrend line, otherwise your just following a mirage.

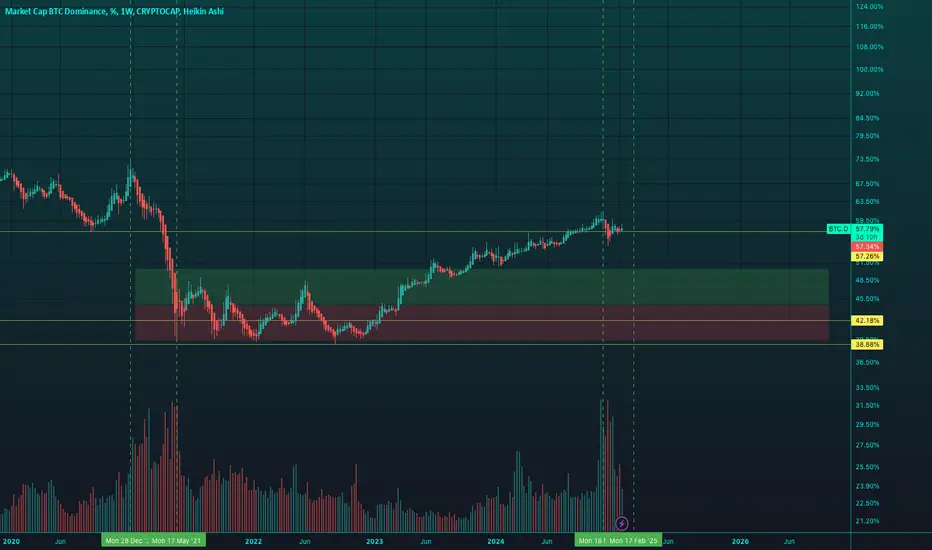
BTC Dominance AnalysisWe are currently observing a key resistance zone (labeled as "A") between 59% and 60% dominance. The price action shows a potential rejection from this area, suggesting that BTC dominance might struggle to break above this level in the short term.
If the rejection occurs as expected, we could see a downward move towards the highlighted support zone (labeled as "B") around 54.5% - 55%. This zone represents a significant area of buyer interest and could lead to a reversal or stabilization.
Key Levels:
Resistance (Zone A): 59% - 60%
Support (Zone B): 54.5% - 55%
Projection:
If rejection from Zone A occurs, a bearish movement towards Zone B is likely.
A potential bounce from Zone B could lead to a recovery in BTC dominance.

Ready for Altseason?? Hi fellow traders, BTC.D will be ready to make a wave lower from the blue box after it completes the ABC correction. When the dominance of BTC starts to decline the Altcoins will rise. The BTC.D chart could potentially go up till the green fib line within the blue box. I think this will be a good time to position yourself. Target will be the previous bottom. Good luck and trade safe!

BTC.D : Alt -season 2025Hi friends,
As you can see on the Bitcoin Dominance chart on the weekly time frame, I would like to remind you of the start of the 2025 Alt Season.
SecondChanceCrypto
⏰ 19/Jan /25
⛔️DYOR
Always do your research.
If you have any questions, you can write them in the comments below and I will answer them.
And please don't forget to support this idea with your likes and comments.

Alt season is not coming (yet)..Analyzing Fibonacci levels and trading volumes, it doesn’t look like an alt season is imminent. For now, a monthly close above resistance seems necessary, and as BINANCE:BTCUSDT rises, Bitcoin dominance will likely increase. While this might lead to some minor gains in altcoins, they’re unlikely to be substantial.
Two scenarios could unfold:
1. Short Alt Spring: Bitcoin sees a sharp rise followed by a short decline. This could bring a brief uptick for altcoins, but they would then experience a period of stagnation ("bleeding") before a full-scale alt season arrives.
2. Delayed Super Alt Season: A more robust alt season could happen directly, though with a slight delay.
Check the “golden pocket” (between the yellow Fibonacci levels) for crucial resistance and support zones.
Aside from technicals, consider the macroeconomic context: the Fed’s potential rate cuts and quantitative easing are expected to take time, meaning that a significant increase in money supply could be delayed.
Remember to do your own research (DYOR)! NFA.

Bitcoin Dominance Drops: Alt Rally Ahead! Bitcoin Dominance Breakdown Done ✅
#Alts are set to bounce hard! Follow me for alt setups and updates.
Don't miss out!
DYOR, NFA
#Crypto #Altseason

BTC dominance 15 month trend has broken, Alt season startBTC dominance 15 month trend has broken, Alt season start?
With alt coins pumping and meme coin mania its a surefire sign. BTC is slowing its gains and the daily BTC dominance trend has broken. This is generally a good sign Alt season is about to start

Bitcoin DomI’m expecting Bitcoin dom to break out and test the 95% range. Close the gap, or at least make an attempt. It hasn’t moved a lot recently, but what it has done is to retrace the breakout, which was the top of the descending Fibonacci channel. Above here, and it’s a magnet to 95% test.

BTC Dominance logarithmic cycle105 days from the previous cycle top to low market dominance at 39%, should see BTC fall into the red zone around mid february and the end of the market.
Also a likely scenario that invalidates this, is a further purchasing in BTC to 150k following on the 3rd wave of the elliot wave pattern from it's previous low.
However in terms of both it's current dominance being lower than previous markets, and DOW, S&P and Russel 2000 being higher in fibonacci at their 4.236 from each market high to low, it's likely BTC hasn't got the strength left in it to perform, considering this is also the end of a 12 year debt cycle It's unlikely BTC has anything futher.
Additionally Pi cycle top indicators on both BTC Market cap and Price haven't triggered yet, so there is a potential it crosses soon. In which case Alt season runs adjacent with BTC price moving to 150 but Dominance slowly falls to 40% or lower over the next 2 months with no alt season continuing on BTC retracement. This essentially marks the retracement period has started, but will push for a higher price, which is similar to the 2021 market with a double top rather than 2012, or 2017 where BTC topped, and then retraced to 0.702 from a 20% correction.
BTC.D G.O.O.D BYEnothing new and the Dominance of Bitcoin Gonna fall
but that's fine bcz for now D is fall but price is rise = market Bull

#BTC Dominance is getting rejected, It's happening!!BTC Dominance has been rejected and is currently dropping on LTF and HTF.
This is good news for altcoins. It looks like the pain may be over, and now we have to wait for January 20th when Trump takes office, at least that’s my plan.
Of course, you’re free to make your own decisions. I’ve already shared a few altcoins earlier, and I’m still holding onto them, including RENDER, ENA, AAVE, XRP, ATH, MANTA, VVAIFU, and a few others.
More updates are coming soon, stay tuned!
Please support us with your likes and comments.
Thank you
#PEACE

My thoughts are giving me no peace with this idea 2 I've updated my expectations regarding the altseason after reviewing the statistics. I believe the growth of altcoins will happen in two phases: first, a drop in Bitcoin dominance to 40%, followed by a recovery to 45-50%, and then a crash below 30%. I'll share any updates if I make any fixes. The scenario is invalidated if dominance rises to 65-70%

bitcoin dominance updateWhile CRYPTOCAP:BTC.D has a lot of room for a sharp decline, #Bitcoin, on the contrary, has a lot of room to rise, which will be the highlight of the #Altcoins season.

Bitcoin Dominance To 42,0%This is not a drill.
Get ready for another 2021.
Except this one will be bigger.
The bull is cocaine and testosterone fueled.
This is going to make the tech bubble of 2000 look like an intra-day move.
Where I personally attended MURDERING everyone with NOKIA calls.

BTC Dominance UPDATE (12H)This analysis is an update of the analysis you see in the "Related publications" section
Market makers always do things to prevent retail traders from identifying the next direction. The support from the previous analysis has been engulfed, but this bounce is for order accumulation.
Based on the data available for this index, it seems we have a triangle instead of a diagonal wave B. The red zone is where candles could be rejected to the downside, and altcoins may perform better compared to Bitcoin.
A daily candle closing above the invalidation level would completely negate this outlook.
For risk management, please don't forget stop loss and capital management
Comment if you have any questions
Thank You
